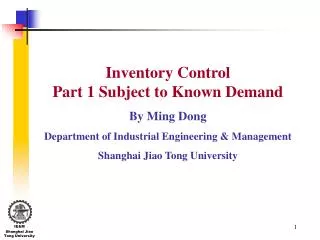
Chapter 5 Inventory Control Subject to Uncertain Demand
820 likes | 2.24k Vues
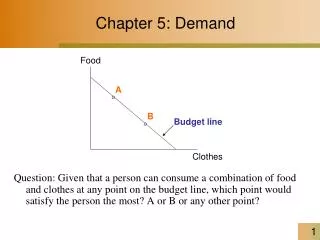
Chapter 5 Inventory Control Subject to Uncertain Demand. Timing Decisions. Quantity decisions made together with decision When to order? One of the major decisions in management of the inventory systems. Impacts : inventory levels, inventory costs, level of service provided Models:

Chapter 5 Inventory Control Subject to Uncertain Demand
E N D
Presentation Transcript
Timing Decisions Quantity decisions made together with decision When to order? One of the major decisions in management of the inventory systems. Impacts: inventory levels, inventory costs, level of service provided Models: • One time decisions • Continuous review systems • Periodic review systems
One-Time Decisions Continuous Decisions Intermittent-Time Decisions Continuous Review System Periodic Review Systems EOQ, EPQ EOQ (S, T) System (Q, R) System (s, S) System Base Stock Optional Replenishment Two Bins Timing Decisions Structure of timing decisions
“newsvendor” model or “Christmas tree” model One-Time Decision Situation is common to retail and manufacturing environment Consider seasonal goods, which are in demand during short period only. Product losses its value at the end of the season. The lead time can be longer than the selling season if demand is higher than the original order, can not rush order for additional products. Example newspaper stand Christmas ornament retailer Christmas tree finished good inventory Trivial problem if demand is known (deterministic case), in practical situations demand is described as random variable (stochastic case).
Example: One-Time Decision Mrs. Kandell has been in the Christmas tree business for years. She keeps track of sales volume each year and has made a table of the demand for the Christmas trees and its probability (frequency histogram). Solution: Q – order quantity; Q* - optimal D – demand: random variable with probability density function f(D) F(D) – cumulative probability function: F(D) = Pr (demand ≤D) co – cost per unit of positive inventory cu – cost per unit of unsatisfied demand Economics marginal analysis: overage and underage costs are balanced
The Concept of Marginal Analysis Marginal analysis: finding the expected profit of ordering one more unit. Probability of not selling Your Last item in stock and having extra inventory on hand at the end on the period P(X < Q) Probability of Selling everything, and facing shortage P(X ≥ Q) Q m
Critical ratio for the newsvendor problem P(X<Q) (Co applies) P(X>Q) (Cu applies) Single Period Inventory Model Marginal Analysis: E (revenue on last sale) = E (loss on last sale)
Example: One-Time Decision (cont) Shortages = lost profit + lost of goodwill Overage = unit cost + cost of disposal of the overage Either ignore the purchase cost, because it does not impact the optimal solution or implicitly consider it in the overage and underage costs. Expected overage cost of the order Q* is P(Demand < Q*) co = F(Q*)co Expected shortage cost is P(Demand > Q*) cu = (1-F(Q*)) cu For order Q* those two costs are equal: F(Q*)co= (1-F(Q*))cu - probability of satisfying demand during the period, also is known as critical ratio To calculate Q* we must use cumulative probability distribution.
Example: One-Time Decision (cont.) Mrs. Kandell estimates that if she buys more trees than she can sell, it costs about $40 for the tree and its disposal. If demand is higher than the number of trees she orders, she looses a profit of $40 per tree.
c = u F ( Q ) + c c u o c = ³ * u Q min{ Q : P ( Q ) } £ X + c c u o Critical fractile for the newsvendor problem • When the demand is a discrete random variable, the condition may not be satisfied at equality (jumps, due to discreteness). Here’s the appropriate condition to use: C(Q+1)-C(Q)=(cu+ co)PX(Q) – cu ≥ 0
Single-Period & Discrete Demand: Lively Lobsters • Lively Lobsters (L.L.) receives a supply of fresh, live lobsters from Maine every day. Lively earns a profit of $7.50 for every lobster sold, but a day-old lobster is worth only $8.50. Each lobster costs L.L. $14.50 • unit cost of a L.L. stockout Cu = 7.50 = lost profit • unit cost of having a left-over lobster Co = 14.50 - 8.50 = cost – salvage value = 6 • target L.L. service level CR = Cu/(Cu + Co) = 7.5 / (7.5 + 6) = .56 • Demand follows a discrete (relative frequency) distribution as given on next page
c = ³ * u Q min{ Q : P ( Q ) } £ X + c c u o Lively Lobsters Demand follows a discrete (relative frequency) distribution: Result: order 25 Lobsters, because that is the smallest amount that will serve at least 56% of the demand on a given night.
The Nature of Uncertainty Suppose that we represent demand as D = Ddeterministic + Drandom If the random component is small compared to the deterministic component, the models used in chapter 4 will be accurate. If not, randomness must be explicitly accounted for in the model. In chapter 5, assume that demand is a random variable with cumulative probability distribution F(D) and probability density function f(D). D - continuous random variable, N(μ, σ) • estimated from history of demand • seems to model many demands accurately • Objective: minimize the expected costs – law of large numbers
The Newsvendor Model The critical ration can also be derived mathematically. At the start of each day, a newsvendor must decide on the number of papers to purchase. Daily sales cannot be predicted exactly, and are represented by the random variable D with normal distribution N(μ, σ), where μ = 11.73 and σ = 4.74 It can be shown that the optimal number of papers to purchase is given by F(Q*) = cu / (cu + co), where cu = 75 – 25 = 50, and c0 = 25 – 10 =15 unrealized profit per unit = (selling price – purchase price); loss per excess = (purchase price – disposal price); F(Q*) = cu / (cu + co) = 0.77 Pr ( D < Q* ) = 0.77 How to find Q* ?
Determination of the Optimal Order Quantity for Newsvendor Example Using table A-4 find z = 0.74, with μ = 11.73 and σ = 4.74 Newsvendor has to order 15 copies every week.
Inv Q=600 LT=3 wk Reorder Point=300 Time Place Order Order arrives Place Order Order arrives If Demand is deterministic (EOQ)
If Demand is stochastic Inv Q=600 LT=3 wk LT=3 wk Reorder Point=300 Time Order arrives Place Order Order arrives Place Order
If Demand is stochastic Inv Q=600 LT=3 wk LT=3 wk Reorder Point=400 Place Order Time Order arrives Order arrives Place Order
Average Inventory Profile Inv Q=600 Avg. Inv =400 Avg. Cycle Inv=300 Safety Stock=100 Time
Terminology • On-hand stock: Stock that is physically on the shelf • Net stock = On-hand stock – Backorders • Inventory Position = On-hand + On-order - Backorders - Committed • Complete backordering: backordered demand is filled as soon as an adequate-size replenishment arrives • Complete lost sales: when out of stock, demand is lost, customers go somewhere else
Why Safety Stock? • Safety Stock: Avg level of the net stock just before a replenishment arrives • Pressure for higher safety stocks • Increased product variety and customization • Increased demand uncertainty • Increased pressure for product availability • Pressure for lower safety stocks • Short product life cycles
The ABC Inventory Classification System The ABC classification, devised at General Electric during the 1950s, helps a company identify a small percentage of its items that account for a large percentage of the dollar value of annual sales. These items are called Type A items. • Adaptation of Pareto’s Law • 20% of the people have 80% of the wealth (in 1897 Italy) • Since most of our inventory investment is in Type A items, high service levels will result in huge investments in safety stocks. • Tight management control of ordering procedures is essential for Type A items.
Class C 100 — 90 — 80 — 70 — 60 — 50 — 40 — 30 — 20 — 10 — 0 — Class B Class A Percentage of dollar value 10 20 30 40 50 60 70 80 90 100 Percentage of items The ABC Inventory Classification System • For Type B items inventories can be reviewed periodically • Items can be ordered in small groups, rather than individually. • Type C items require the minimum degree of control • Parameters are reviewed twice a year. Demand for Type C items may be forecasted by simple methods. The most inexpensive items of type C can be ordered in large lot, to minimize number of orders. An expensive type C items ordered only as they are demanded
Replenishment Policies • When and how much to order • Continuous review with (Q,R) policy: • Inv. is continuously monitored and when it drops to R, an order of size Q is placed • Periodic review with (R,S) policy: • Inv. is reviewed at regular periodic intervals (R), and an order is placed to raise the inv. to a specified level (order-up-to level, S)
Measures of Customer Service:(Average) Product availability measures • Fill rate (P2 ): Percentage of demand that is satisfied from inventory • Compute Expected Shortage per Replenishment Cycle (ESPRC) • P2 = 1-ESPRC/Q • Cycle Service Level (P1 ):Prob. of no stockout per replenishment cycle, or percentage of cycles without stockouts
Comparison of Type 1 and Type 2 Services Order Cycle Demand Stock-Outs 1 180 0 2 75 0 3 235 45 4 140 0 5 180 0 6 200 10 7 150 0 8 90 0 9 160 0 10 40 0 For a type 1 service objective there are two cycles out of ten in which a stock-out occurs, so the type 1 service level is 80%. For type 2 service, there are a total of 1,450 units demand and 55 stockouts (which means that 1,395 demand are satisfied). This translates to a 96% fill rate.
Continuous Review Systems • The EOQ, production lot size, and planned shortage models assume continuous review • (Q, R) Policies • These models call for policies prescribing an order point (R) and order quantity (Q) • Such policies can be implemented by • A point-of-sale computerized system • The two-bin system: use inventory from bin 1 until empty which triggers reorder… replenishment fills bin 2 and remainder goes into bin 1
Order Point, Order Quantity Model (R,Q) R + Q • Inventory position constantly monitored • Inventory position used to place an order, and not the net stock • Stockout occurs if demand during lead time exceeds the reorder point • Simple system… suppliers like the predictability of constant order quantities Inventory Level R Safety Stock (SS) Place order Receive order Time Lead Time
Probabilistic ModelsWhen to Order Expected Demand Inventory Level P(Stockout) Freq Optimal Order Quantity SS s Reorder Point , R Safety Stock (SS) Place order Receive order Time Lead Time
IP IP Order received Order received Order received Order received Q Q Q On Hand On-hand inventory R Order placed Order placed Order placed Time L1 L2 L3 TBO1 TBO2 TBO3 Uncertain Demand
Expected Inventory (Assumptions) I(t) Q Slope -l SS Time
Expected cost function • Include expected: holding, setup, penalty and ordering (per unit) costs • Average Holding Cost: • Average Set-up Cost:
Expected cost function • Expected Shortage per Cycle: • Interpret n(R) as the expected number of stockouts per cycle given by the loss integral formula. • The unit normal loss integral values appear in Table A-4. • Expected Penalty Cost :
Expected Cost Function: Partial Derivatives: (1) (2) Cost Minimization This is the first equation we will use to determine optimal values Q and R
Partial Derivatives: (2) Cost Minimization This is the second equation we will use to determine optimal values Q and R
Solution Procedure • The optimal solution procedure requires iterating between the two equations for Q and R until convergence occurs • A cost effective approximation is to set Q=EOQ and find R from the second equation.
Finding Q and R, iteratively 1. Compute Q = EOQ. 2. Substitute Q in to Equation (2) and compute R. 3. Use R to compute n(R) in Equation (1). 4. Solve for Q in Equation (1). 5. Go back to Step 2, continue until convergence.
Example • A company purchases air filters at a rate of 800 per year • $10 to place an order • Unit cost is $25 per filter • Inventory carry cost is $2/unit per year • Shortage cost is $5 • Lead time is 2 weeks • Assume demand during lead time follows a uniform distribution from 0 to 200 • Find (Q,R)
Solution • Partial derivative outcomes:
Solution • From Uniform U(0,200) distribution:
0 200 R Solution • Iteration 1: F(R)
Solution • Iteration 2:
Solution • Iteration 3:
Solution • R didn’t change => CONVERGENCE • (Q*,R*) = (94,190) I(t) 253 Slope -800 190 159 With lead time equal to 2 weeks: SS = R – lt =190-800(2/52)=159
Example • Demand is Normally distributed with mean of 40 per week and a weekly variance of 8 • The ordering cost is $50 • Lead time is two weeks • Shortages cost an estimated $5 per unit short to expedite orders to appease customers • The holding cost is $0.0225 per week • Find (Q,R)
Solution • Demand is per week. • Lead time is two weeks long. Thus, during the lead time: • Mean demand is 2(40) = 80 • Variance is (2*8) = 16 • Demand observed in one week is independent from demand observed in any other week: • E(demand over 2 weeks) = E (2*demand over week 1) = 2 E(demand in a single week) = 2 μ = 80 Standard deviation over 2 weeks is σ = (2*8)0.5 = 4
Finding Q and R, iteratively • 1. Compute Q = EOQ. • 2. Substitute Q in to Equation (2) and compute R. • Use R to compute average backorder level, n(R) to use in Equation (1). • 4. Solve for Q using Equation (1). • 5. Go to Step 2 until convergence.
Solution • Iteration 1: • From the standard normal table:
Solution • Iteration 2: This is the unit normal loss expression. Table A - 4 gives values.