A Framework to Analyze, Compare, and Optimize High-Performance, On-Board Processing Systems
This framework provides a theoretical approach to determine Pareto-optimal device and fault-tolerant strategies for on-board processing systems, especially in small satellites, UAVs, smart munitions, and AUVs. By dividing the exploration space into key components including device set, fault-tolerance strategies, mission characteristics, and application set, it allows for a generalized comparison. The methodology employed evaluates designs based on computational density, power consumption, and dependability metrics, ultimately aiding in the selection of optimal architectures for various missions.

A Framework to Analyze, Compare, and Optimize High-Performance, On-Board Processing Systems
E N D
Presentation Transcript
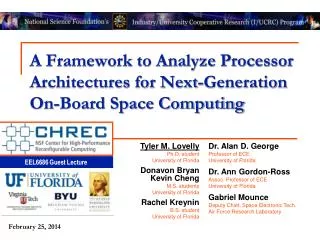
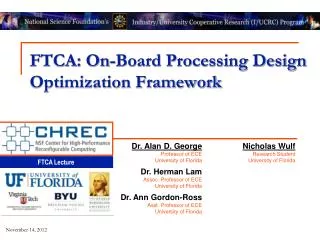
A Framework to Analyze, Compare, and Optimize High-Performance, On-Board Processing Systems Nicholas Wulf Alan D. George Ann Gordon-Ross 3/5/2012
On-Board Proc. Framework • Goal: Provide theory for determining Pareto-optimal device &fault-tolerant (FT) strategy for on-board processing systems • Focus on small satellites, UAVs, smart munitions, AUVs • Generalized comparison framework deters ad hocdesign methodology, leading to Pareto-optimal designs • Approach: Divide exploration space into its key components for study • Device Set –Includes CPUs, DSPs, FPGAs, GPUs, & any Rad-Hard versions • FT Strategies –Sacrifice resources for fault tolerance (may be app-specific) • Mission Characteristics –Definessystem’s environmental conditions • Application Set –Includes mostcommon kernels (e.g., space apps.) • Analysis –Design evaluation metricscalculated from other components • Is selected design acceptable? • How does it compare to others? Application Kernel Set Mission Characteristics Device Set Analysis FT Strategy Set
Calculating Computational Density • Computational Density (CD) used to analyze device performance • Developed within CHREC at the University of Florida • Applicable to wide range of architectures (e.g., CPU, DSP, GPU, FPGA, etc.) • Produces results in terms of operations per second • Different CD result for each type of precision (e.g., bit, 8-bit int., 64-bit double) • CD also depends on type of operation (e.g., add, multiply, divide) • Standard objective methodology for calculating CD on FPGAs • Generate and analyze compute core on FPGA • Perform twice for each core; one with andone without DSP resources • Core must match desired precision & operation • Collect data on resources used and max freq. • Use optimal packing algorithm to determine maximum number of cores on device • CD equals number of cores times worstclock rate from the list of cores used
Framework Methodology Power Power • Designs evaluated according to two metrics • Power – power consumed by device • Sensor data rate & application determineamount and type of required processing • Device utilization is ratio of correspondingdevice CD to required processing • FT strategy overhead increases utilization • Linear interpolation between power rangeto find power consumption • Dependability – time between failures • Device radiation characteristics and environment determine device upset rate • Low utilization causes lower vulnerability • FT strategies help to mitigate upsets Sensor Sensor Dependability Dependability Device TMR Utilization: 72% Utilization: 24% Consumed Device Upset Rate: 10 upsets/day 72% Device Cross-Section (SEE / Particle·m2) Environmental Radiation(Particles / m2·ster·s) Device Max 0 50 100 LET Static Only 72% of device is vulnerable 0% 50% 100% TMR protects against 99% of upsets Utilization 13.89 0.14 0.10 MTBF: days MTBF = Mean Time Between Failures TMR = Triple-Modular Redundancy CD = Computational Density
HSI Case Studies • Hyperspectral Imaging (HSI) enables detection of key materials within a scene • Detects intensities of hundreds of wavelengths for each pixel forming an image cube • Compares characteristic spectrum of pixels to spectral signatures of desired materials • Marks location of identified materials within the scene • Image cube too large for transfer to processing station due to limited bandwidth • Solution: perform computation in-situ and only transfer final results • Two HSI missions chosen as case studies for on-board processing • Hyperion on EO-1 satellite requiring 2.2×10⁹ 32-bit integer MAC/s • AVIRIS on ER-2 aircraft requiring 348×106 32-bit integer MAC/s Identify Detect Compare MAC = Multiply Accumulate
Raw Results • Studied design combinations of 6 FPGAs and 3 fault-tolerant strategies • Devices: 3 standard Virtexes, 2 low power Spartans, and 1 Rad-Hard SIRF • Fault-tolerant strategies: • No fault tolerance (NFT): 0% overhead and no added reliability • Algorithm-based FT (ABFT): 10% overhead and significant added reliability • Triple-modular redundancy (TMR): 200% overhead and strongest reliability • Power consumption and dependability metrics calculated for each design Values predicted with linear regression on feature size in underlined italics FPGA = Field-Programmable Gate Array
Optimal Design Selection • Framework determines Pareto-optimal designs based on metrics • Non-Pareto-optimal designs can be completely ignored • Constraints on metrics enforced to remove invalid designs • Removes unreliable and/or power-hungry designs based on mission • Out of 18 designs, only 5 designs selected as optimal for each mission • Designers decide which design is best based on desired tradeoffs EO-1 Hyperion Satellite ER-2 AVIRIS Aircraft
Conclusions and Future Research • Conclusions • The design of on-board processing systems can be complicated • Many constraints due to sparse and hostile environments • Many combinations of devices and FT-strategies to consider • Our framework simplifies exploration space and highlights most promising designs, allowing designers to choose best design for their needs • Future Research • Add CPUs to list of studied devices (from high performance to low power) • Consider memory devices in addition to processors • Integral to on-board processing systems • Affects performance, power, and dependability • Expand framework to include metrics such as lifetime (TID), cost, size/weight,maximum dose rate