Download
1 / 21
210 likes | 367 Vues
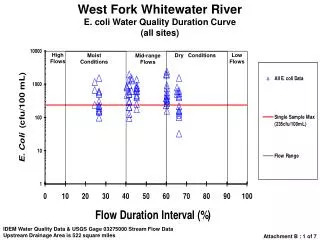
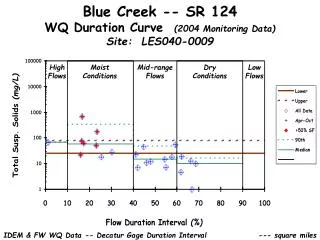
Blue Creek -- SR 124 WQ Duration Curve (2004 Monitoring Data) Site: LES040-0009. High Flows. Moist Conditions. Mid-range Flows. Dry Conditions. Low Flows. IDEM & FW WQ Data -- Decatur Gage Duration Interval. --- square miles.

E N D
Blue Creek -- SR 124WQ Duration Curve (2004 Monitoring Data)Site: LES040-0009 High Flows Moist Conditions Mid-range Flows Dry Conditions Low Flows IDEM & FW WQ Data -- Decatur Gage Duration Interval --- square miles
Yellow Creek -- CR 250 SWQ Duration Curve (2004 Monitoring Data)Site: LES040-0038 High Flows Moist Conditions Mid-range Flows Dry Conditions Low Flows IDEM & FW WQ Data -- Decatur Gage Duration Interval --- square miles
NameWQ Duration Curve (2004 Monitoring Data)Site: LES040-x High Flows Moist Conditions Mid-range Flows Dry Conditions Low Flows IDEM & FW WQ Data -- Decatur Gage Duration Interval --- square miles
St. Mary’s River at Pleasant MillsWQ Duration Curve (2004 Monitoring Data)Site: LES040-0007 High Flows Moist Conditions Mid-range Flows Dry Conditions Low Flows IDEM WQ Data -- Decatur Gage Duration Interval --- square miles
Gates Ditch -- CR 400 SWQ Duration Curve (2004 Monitoring Data)Site: LES040-0023 High Flows Moist Conditions Mid-range Flows Dry Conditions Low Flows IDEM WQ Data -- Decatur Gage Duration Interval --- square miles
Little Blue Creek -- CR 400 SWQ Duration Curve (2004 Monitoring Data)Site: LES040-0010 High Flows Moist Conditions Mid-range Flows Dry Conditions Low Flows IDEM WQ Data -- Decatur Gage Duration Interval --- square miles
Blue Creek -- SR 300 SWQ Duration Curve (2004 Monitoring Data)Site: LES040-0011 High Flows Moist Conditions Mid-range Flows Dry Conditions Low Flows IDEM WQ Data -- Decatur Gage Duration Interval --- square miles
Blue Creek -- SR 124WQ Duration Curve (2004 Monitoring Data)Site: LES040-0009 High Flows Moist Conditions Mid-range Flows Dry Conditions Low Flows IDEM & FW WQ Data -- Decatur Gage Duration Interval --- square miles
Yellow Creek -- CR 250 SWQ Duration Curve (2004 Monitoring Data)Site: LES040-0038 High Flows Moist Conditions Mid-range Flows Dry Conditions Low Flows IDEM & FW WQ Data -- Decatur Gage Duration Interval --- square miles
NameWQ Duration Curve (2004 Monitoring Data)Site: LES040-x High Flows Moist Conditions Mid-range Flows Dry Conditions Low Flows IDEM WQ Data -- Decatur Gage Duration Interval --- square miles
Blue Creek -- SR 124WQ Duration Curve (2004 Monitoring Data)Site: LES040-0007 High Flows Moist Conditions Mid-range Flows Dry Conditions Low Flows IDEM & FW WQ Data -- Decatur Gage Duration Interval --- square miles
NameWQ Duration Curve (2004 Monitoring Data)Site: LES040-x High Flows Moist Conditions Mid-range Flows Dry Conditions Low Flows IDEM & FW WQ Data -- Decatur Gage Duration Interval --- square miles
Vermillion River near FarmingtonWQ Duration Curve (1981 - 2003 Monitoring Data)Site: VR-32.5 High Flows Moist Conditions Mid-range Flows Dry Conditions Low Flows MPCA Data & USGS Gage Duration Interval 129 square miles
Vermillion River near FarmingtonWQ Duration Curve (1981 - 2003 Monitoring Data)Site: VR-32.5 High Flows Moist Conditions Mid-range Flows Dry Conditions Low Flows MPCA Data & USGS Gage Duration Interval 129 square miles
Vermillion River near FarmingtonLoad Duration Curve (1981 - 2003 Monitoring Data)Site: VR-32.5 High Flows Moist Conditions Mid-range Flows Dry Conditions Low Flows MPCA Data & USGS Gage Duration Interval 129 square miles
Harpeth River at Pegram Bridge (RM 73.1)Load Duration Curve (1975 - 2003 Monitoring Data)Site: 0014311 High Flows Moist Conditions Mid-range Flows Dry Conditions Low Flows TDEC Data & USGS Gage Duration Interval 191 square miles
Buffalo River at Bell Bridge (RM 73.1)Load Duration Curve (1982 - 2003 Monitoring Data)Site: 000408 High Flows Moist Conditions Mid-range Flows Dry Conditions Low Flows TDEC Data & USGS Gage Duration Interval 447 square miles
Vermillion River near FarmingtonLoad Duration Curve (1981 - 2003 Monitoring Data)Site: VR-32.5 High Flows Moist Conditions Mid-range Flows Dry Conditions Low Flows MPCA Data & USGS Gage Duration Interval 129 square miles
Wolf Creek at LaPorte City, IAWQ Duration Curve (1999 - 2003 Monitoring Data)Site: 10070002 High Flows Moist Conditions Mid-range Flows Dry Conditions Low Flows DNR Data & Beaver Gage Duration Interval 299 square miles
White River near Oglala, SDWQ Duration Curve (1974 - 1998 Monitoring Data)Site: 460842 DENR WQ Data & USGS Flows 2,200 square miles
White River near Oglala, SDWQ Duration Curve (1974 - 1998 Monitoring Data)Site: 460842 DENR WQ Data & USGS Flows 2,200 square miles