Download
1 / 36
360 likes | 514 Vues
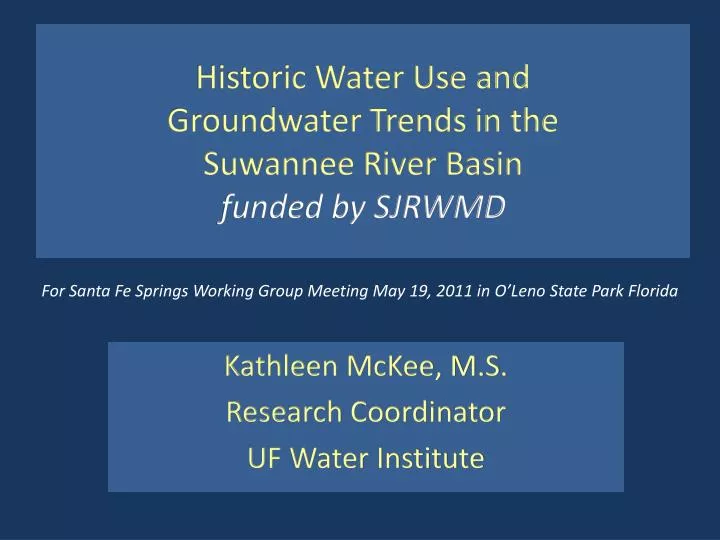
Historic Water Use and Groundwater Trends in the Suwannee River Basin funded by SJRWMD. For Santa Fe Springs Working Group Meeting May 19, 2011 in O’Leno State Park Florida. Kathleen McKee, M.S. Research Coordinator UF Water Institute.

E N D
Historic Water Use and Groundwater Trends in the Suwannee River Basin funded by SJRWMD For Santa Fe Springs Working Group Meeting May 19, 2011 in O’Leno State Park Florida Kathleen McKee, M.S. Research Coordinator UF Water Institute
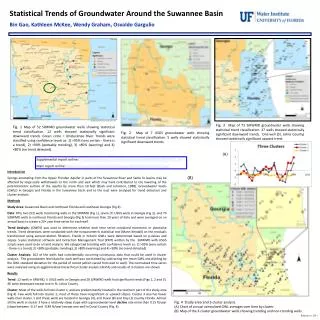
Statistical Evaluation Of Long Term Groundwater Level In Northeastern Florida And Southern Georgia • This project involved compilation and statistical trend analyses of historic hydrologic data (groundwater levels, rainfall, streamflow) • in Suwannee River Basin counties • of Florida and Georgia • from 1980 to 2007
Also analyzed GW in northeast FL counties
SPRINGSHEDS Ichetucknee and Santa Fe springs
Number of Stations • 132 groundwater levels (SRWMD, SJRWMD, USGS) • Includes NE Florida wells from SJRWMD • ONLY wells in the Floridan aquifer • 44 rainfall stations (NCDC) • 22 streamflowstations (USGS)
Data Compilation • Data combined into annual calendar year time series for the period 1980 to 2007 • Annual average time series were used for groundwater & streamflow • GWL: 20 years of data with at least 2 measures / year • Streamflow: 10 years of daily averages • Total annual inches time series were used for rainfall • Rain: 20 years of data with at least 8 monthly total / year • Additional groundwater level data in northeast Florida and southeast Georgia were added (request from SJRWMD).
Statistical Trends • LOWESS – graphical evaluation to determine if monotonic or piecewise (Cleveland, 1981) • Trend detections (for both monotonic and piecewise) were conducted using Mann-Kendall test (Hamed, 2008; Hamed and Rao, 1998) • Confid levels: • > 95%, very certain(there is a trend) (p-value < 0.05) • > 90%, probably trending (p-value < 0.10) • > 80%, possible (p-value < 0.20) • < 80%, no trend detected
Monotonic Very certain downward Slope = 1.38 ft/yr p-value = 0.014
Monotonic No Trend Detected p-value = 0.175 slope = -0.099 ft/yr
Piecewise 1st section: Very certain upward p-value = 0.014 slope = 1.38 ft/yr 2nd section No Trend Detected p-value = 0.161 slope = 0.478 ft/yr
73 SJRWMD, USGS -Groundwater level Upward trend
22 NCDC – rainfall No trends
22 NCDC - rainfall 1 trending down Dixie
2 rain stations NO trend P-value = 0.22 Trend P-value = 0.01
9 USGS – streamflow No trends
13 USGS – stream flow No trends
GW Trend Results Significant trends (conf level > 85%): • 12 wells in SRWMD • 5 USGS wells in Georgia • 28 SJRWMD wells All were downward except one in St. Johns County.
Counties with Signif GW reduction • Georgia • Worth, Tift, Cook • Florida (SRWMD) • Baker, Bradford, Lafayette, Union
Water Use data estimation • from 1980 to 2007 in millions of gallons per year. • Agricfrom USGS = Agricultural calculated by USGS every 5 years using estimated irrigated crop acreage multiplied by a use coefficient from selected crop irrigation models; • Agric we calculated = estimated crops reported by NASS * recommended irrigation for that crop • DomSelfSup= Domestic Self-Supply (USGS calculates using statewide per capita water use rate * population not using public supply)¥; • PubSupp= Public Supply (from monthly permittee reporting); • CommIndPow= Industrial/commercial/mining/power (from monthly permittee reporting).
Water Use estimation data Tift County Georgia
Water Use estimation data Cook County Georgia
Water Use estimation data Baker County Florida
Water Use estimation data Bradford County Florida
Water Use estimation data Lafayette County Florida
Water Use estimation data Union County Florida
Water use data 5 year reports done by Rich Marella at USGS: http://pubs.usgs.gov/sir/2009/5125/
Water Use: important & not easy! Here is what Agriculture estimates look like when we try to do them:
Water Use: important & not easy! Here is what Agriculture estimates look like when we try to do them:
Thank you! Kathleen McKee katmckee@ufl.edu Reports online: http://www.sjrwmd.com/technicalreports/pdfs/SP/SJ2010-SP12.pdf http://www.sjrwmd.com/technicalreports/pdfs/SP/SJ2010-SP11.pdf