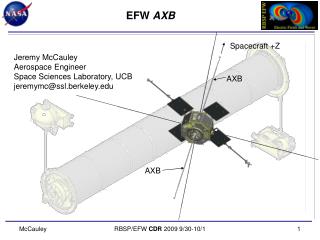
EFW Data Collection and Science Quantities for SOC Activities - Draft Report
This draft report outlines the electrostatic field wave (EFW) team's contributions to SOC activities, detailing a variety of measurements that are crucial for diagnostic purposes. Key data include 2-D spin fit electric field measurements, spacecraft potential as a density indicator, instantaneous electric field vectors, and frequency vs. time spectra. The EFW team also seeks data from other instruments, such as plasma density from HOPE and spectrograms from ECT and REPT, to gain insights into plasma dynamics. This comprehensive approach enhances our understanding of space weather phenomena.

EFW Data Collection and Science Quantities for SOC Activities - Draft Report
E N D
Presentation Transcript
EFW SOC DATA John Wygant SWG June 18-19. 2009 Redondo Beach
Draft EFW provided science quantities The EFW team will provide and display the following data in support of SOC activities: • 2-D Spin fit electric field measurements (6 second resolution) with a preliminary VxB subtraction • Spacecraft potential as indicator of density: (V1+V2)/2 (32 samples/s ) • Instantaneous spin plane electric field vectors (32 samples/s) • Fast Broadband E-field peak/average filter data (8 samples/s; 8-16 frequency bins over 1Hz -2kHz) • Begin and end times, sampling rates, sampled quantities of bursts data stored in instrument memory, other information on instrument mode • Frequency vs time spectra of E and B (as calculated on board). • Detrended spin axis E-field component 32 samples/s EFW will have a variety of measurements that are used for diagnostic purposes ie V1s, V2s, V3s, V4s, V5s, V6s
Desired science quantities from other instruments/platforms The EFW team “desires” the following data from other instruments • Indicator of plasma density from HOPE • HOPE; ECT;REPT; RBSPICE ion/electron energy time spectrograms and or line plots vs time (or L-value) from representative energy and pitch angles to indicate intervals of injection and perpendicular or parallel acceleration (similar to CDAW WEB). 3/decade. Could data include in orbit vs L value format; • Electrons: 100 eV to 6 MeV; PA at 30 degree intervals • H+,O+: 100 eV to 400 keV (counts/s?differential energy flux?).PA at 30 degree PA. • EMFISIS: Magnetic field vector in inertial coordinate system (DSC, GSE) (16Hz) model subtraction • EMFISIS: Frequency time spectograms including information on power up to 400 kHz). power of different waves; plasma line, hiss, chorus, AKR • Information on begin times and durations and nature of high time resolution modes • SC attitude and position information • Ability to detrend fluxes; ability to subtract average flux/counts from previous orbit to provide information on changes from orbit to orbit: • Information from from Millstone Hill (John Foster is an EFW Co-I) • Geomagnetic activity indices (AE,DST) • IMF information…(velocity density, magnetic field) • Information on BARREL status, position of payloads, preliminary information on X ray counts • Information from other relevant spacecraft (position, data?- SSC)