Download
1 / 13
Visual Representation of Data Across Multiple Figures and Tables in Research Study
130 likes | 263 Vues
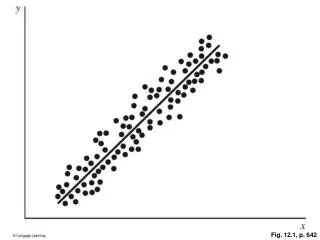
This document provides a concise overview of significant figures and tables from pages 642 to 660. Included are visual data representations such as Fig. 12.1 and Fig. 12.2, alongside critical tables from page 646. The figures illustrate key research findings, while the tables compile essential data for a comprehensive understanding of the study. Each representation is crucial for highlighting trends and patterns, offering readers a clearer picture of the research results discussed throughout the surrounding text.
Télécharger la présentation 
Visual Representation of Data Across Multiple Figures and Tables in Research Study
An Image/Link below is provided (as is) to download presentation
Download Policy: Content on the Website is provided to you AS IS for your information and personal use and may not be sold / licensed / shared on other websites without getting consent from its author.
Content is provided to you AS IS for your information and personal use only.
Download presentation by click this link.
While downloading, if for some reason you are not able to download a presentation, the publisher may have deleted the file from their server.
During download, if you can't get a presentation, the file might be deleted by the publisher.
E N D


More Related