Download
1 / 39
390 likes | 406 Vues
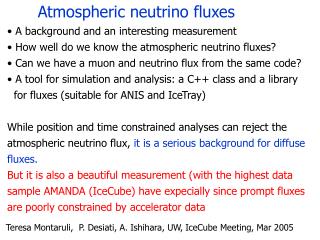
Explore water control structures and flows in the SFWMD's ODSS prototype project, analyze time series data, and develop tools for water balancing in Arc Hydro framework.

E N D
Lecture 2: Fluxes, Flows and Volumes • Readings for today: Applied Hydrology • Section 6.3 on Measurement of Streamflow • Sections 2.1 – 2.3 on Continuity (Water Balance) • Arc Hydro: GIS for Water Resources pp. 155-157 • Reading for Tues: Applied Hydrology • Section 2.7 – 2.8 Energy balance
Definitions • Flow = Volumetric discharge of water [L3/T] • Flux = Flow per unit area [L/T] • Volume = Integral of flow through time [L3]
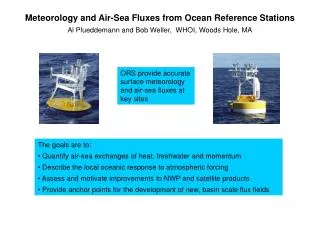
ODSS AHED Prototype Project Prototype Area • Prototype region includes 24 water management basins, including Lake Kissimmee, Lake Okeechobee, and Lake Istokpoga • More than 70 water control structures managed by the South Florida Water Management District (SFWMD) within the prototype area • Includes natural and managed waterways Lake Kissimmee Lake Istokpoga Lake Okeechobee
Objectives of the Project • Extend the ArcHydro Framework to include the Operations Decision Support System (ODSS) • Develop tools that account for rainfall accumulation and provide water balancing capabilities to the Extended ArcHydro Framework • Develop an ODSS model that includes water-conveyance routing
Questions that SFWMD wants Answered • How much water is there? • Where is the water in the District? • How much water will enter the canal system? • How can water be routed from one basin to another?
WCU Links and Nodes WCUNode WCULink Watershed to WCU WCU to WCU
Network Tracing A path between Lake Kissimmee and Lake Okeechobee
Value Time Geospatial Time Series Object Time Series Properties (Type) A Value-Time array Shape
HydroID to FeatureID association HydroID = 1071381 Area = 33314542079 ft2 Gives each time series a shape FeatureID = 1071381 HydroCode = Martin-St Lucie
TSTypeID Association Gives each time series a type
Time Series Object A new time series can be created from a Arc Hydro GDB given a FeatureID and TSTypeID Properties • FeatureID HydroID of the feature related to the time series • HydroCode HydroCode of the feature related to the time series • TSTypeID UnquieID of the TimeSeries • Variable Description of the TimeSeries (i.e. Daily Streamflow) • Units Measurement units as a string (i.e. cfs, in/d) • UnitType Measurement unit type (i.e. flow, area flux, volume, etc.) • TSValues() Array of Values • TSDateTimes() Array of DateTimes • IsRegular Indicates if TimeSeries is measured regularly (boolean) • TSOrigin Either Generated or Measured • TSDateType Either Instantaneous, Cumulative, Incremental, Averaged, Min, or Max Methods • AddToChartSpace Writes the time series to the chartspace • WriteToGDB Writes the time series to an Arc Hydro geodatabase • GetCumulativeTS Returns a new time series object that with its values cumulated through time • GetMinDate Returns the minimum date in the time series • GetMaxDate Returns the maximum date in the time series
Time Series Collection Object A bag of time series objects used to compute a new time series object Properties • Variable Description of the TimeSeries (i.e. Daily Streamflow) • Units Measurement units as a string (i.e. cfs, in/d) • UnitType Measurement unit type (i.e. flow, area flux, volume, etc.) • TSValues() Array of Values • TSDateTimes() Array of DateTimes • IsRegular Indicates if TimeSeries is measured regularly (boolean) • TSOrigin Either Generated or Measured • TSDateType Either Instantaneous, Cumulative, Incremental, Averaged, Min, or Max Methods • GetTimeSeries Writes the time series to the chartspace • AddTimeSeries Writes the time series to an Arc Hydro and whether the TS is either contribution or diminishing the resulting time series
Toolbar Chart Space
The Toolbar • Plot Time Series • Plot Fluxes, Flowrates, etc. • Set TimeSeries and TSTypeID table paths • Show/Hide ChartSpace window
Plot Time Series Tool Step 1: Select layer and TSType to plot 1. Select a layer from those listed in map 2. Select a TSType (filtered for selected layer) 3. Limit time range to plot (optional)
Plot Time Series Tool Step 2: Select feature to plot time series for Map shows only features in selected Layer that have time series Chart is plotted according to the attributes of the time series (averaged, instanteous, units, etc.) 2. Select feature to plot time series for
Plot Fluxes & Flows Tool Step 2: Select feature to plot variable(s) for 1. Select a layer from those listed in map 2. Select one or more variables to plot
Plot Fluxes & Flows Tool Step 1: Select layer and variable(s) to plot Map shows only features coupled to the feature the mouse is currently over Variables(s) are plotted for selected feature
Cumulating Series Cumulate a time series by right-clicking Streamflow (cfs) to Volume (acre ft) Rainfall Flux (in/day) to Cumulative Rainfall (in)
Chart Overview TimeSeries’ UnitType ChartSpace can contain multiple charts each with a unique value axis TimeSeries’ Units TimeSeries’ Variable Feature’s HydroCode
Scaling the Time Axis By right-click on the chart’s time axis, one can aggregate the data to a new time scale. Daily Averaged Weekly Averaged Monthly Averaged
Flux to Flowrate Flux is related to a geometry allowing the transformation of a flux time series to a flowrate time series on the fly Flow (cfs) Evaporative Flux (mm/day) Evaporation Flow in cfs
Water Balancing • Break water movement into two components:Horizontal W.B.(canal system) VerticalW.B.(rainfall, evapotranspiration) • Horizontal water movement into and out of a WCU is measured at points and is measured as flow [ft3/s] • Vertical water movement into and out of a WCU is measured at points, or over areas, and is measured as a flux [in/d]
qVin Control Volume QHout QHin qVout Water Balancing Control Volume for water balancing is a Water Control Unit. qVin = rain QHin = structure flow in qVout = ETp QHout = structure flow out Change in Storage
Volume Storage Over a WCU: C41A-North Total Net Inflow Horizontal Net Inflow Vertical Net Inflow 1 year: Nov 1, 2002 – 30 Oct 2003