Financial Estimates
Financial Estimates. Stephanie Schmit July 2, 2013 Source: Charlie Tillett nutsandbolts.mit.edu/session2.php. Basics. Profit = Revenue – Cost Revenue = Price * Quantity Cost = How much the company spent Price = How much the customer pays.

Financial Estimates
E N D
Presentation Transcript
Financial Estimates Stephanie Schmit July 2, 2013 Source: Charlie Tillett nutsandbolts.mit.edu/session2.php
Basics Profit = Revenue – Cost Revenue = Price * Quantity Cost = How much the company spent Price = How much the customer pays
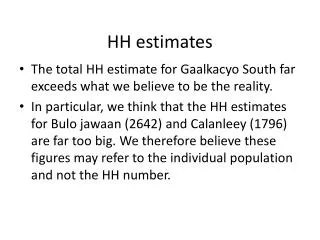
I want to open a chocolate store on BMS campus Will it be profitable?
What is “The Business Model” • Provides the super-structure for the Financial Plan • Blueprint of how business will MAKE MONEY • Documented by an Income Statement • Financial performance in percentage terms In assessing YOUR business model • Determine what your business will look like once you reach critical mass
Building a Tech Model • Your product • Price that customer will pay • Cost of Goods Sold (COGS) – Unit costs & mfg O/H & support • Distribution Strategy • May impact your sales price • May impact S & M and support expenses • R&D should end up at 10% to 20 • G&A should end up at 5% to 15% • Target an operating profit of 15% to 20%
Building Financial ProjectionsTechnology Company Rules-of-Thumb • Staffing DRIVES departmental expenses • Average employee salary will be $90K + - • Employee benefits will add just 15% • Salaries will be 60% to 70% of total expenses (non-COGS) • Remainder will be rent, utilities, travel, etc. • UNLESS you have extraordinary marketing!!! • Will reduce to 50% to 55% over time • Sales staff will cost $175 to $250k per person per year • ~$200k compensation (50% base, 50% commission) • $50k in annual travel costs • Disclaimer - May not apply to your company
Building Financial ProjectionsTechnology Company Rules-of-Thumb • Sales Projections • $50MM to $100MM in year 5 • Revenue per Employee • Between $150K and $350K • Revenue per Salesperson • Between $1MM and $3MM
Cash Flow Projections Happiness is a positive cash flowOr at least knowing when you need to raise more • Burn Rate • Monthly operating loss plus capital expenditures • Cash Flow Projection • Cumulative operating losses excluding depreciation • Plus cumulative capital expenses • To determine the total cash required • Cumulative operating losses PLUS • Cumulative capital expenses • On the month that you turn cash positive
How Much to Pay Yourself • VCs don’t want their entrepreneurs to starve BUT They want them to be hungry
End Result 4 year Profit and Loss Statement Red – Input Magenta – TO another spreadsheet Black – Calculated Blue – FROM another spreadsheet
Profit and Loss Statement Quarterly Red – Input Magenta – TO another spreadsheet Black – Calculated Blue – FROM another spreadsheet
Sales and COGS Forecast Red – Input Magenta – TO another spreadsheet Black – Calculated Blue – FROM another spreadsheet
Staffing Plan Red – Input Magenta – TO another spreadsheet Black – Calculated Blue – FROM another spreadsheet
Salary Expenses Red – Input Magenta – TO another spreadsheet Black – Calculated Blue – FROM another spreadsheet
Non-Salary Expenses Red – Input Magenta – TO another spreadsheet Black – Calculated Blue – FROM another spreadsheet
Non-Salary Expenses Red – Input Magenta – TO another spreadsheet Black – Calculated Blue – FROM another spreadsheet
Profit and Loss Statement Quarterly Red – Input Magenta – TO another spreadsheet Black – Calculated Blue – FROM another spreadsheet
CAPEX & Cash Flow Red – Input Magenta – TO another spreadsheet Black – Calculated Blue – FROM another spreadsheet
Financial DataPresentation Suggestions • Steady, consistent evolution of your model • Revenue growth in $ • Expenses over time in % • Show % next to quarterly & yearly columns • Show pre-tax only • Don’t allocate G&A expenses
Executive SummaryPresentation Suggestions • Annual P&L for 4 or 5 years (with %) • Data to justify revenue projections • Unit sales • Average selling price (ASP) • What quarter you will be profitable • Your total cash requirement
Full Business PlanPresentation Suggestions • Page 1: Annual P&L for 4 years • Page 2 & 3: Quarterly P&L for all 4 years • Page 4: Quarterly Staffing plan for 4 years • Page 5: Quarterly cash flow for 4 years