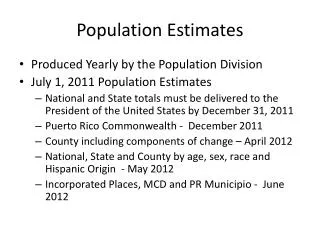
Population Estimates
Population Estimates. 2012 Texas State Data Center Conference for Data Users May 22, 2012 Austin, TX. Population Estimates. size of the past or current population of a specific geographic area for which census counts are not available in lieu of an actual census count

Population Estimates
E N D
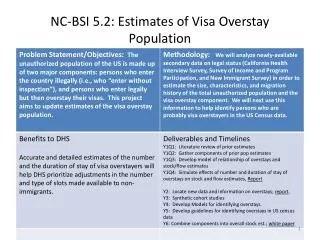
Presentation Transcript
Population Estimates 2012 Texas State Data Center Conference for Data Users May 22, 2012 Austin, TX
Population Estimates • size of the past or current population of a specific geographic area for which census counts are not available • in lieu of an actual census count • used to update population data gathered by the last census Methods closely related to methods of population projections. projections focus on the future estimates mainly focus on the present or the recent past Estimates based on observed data about population changes (births, deaths and migration), Projections are for dates with no observed data.
Estimates: Applications and Issues • important contribution to the activities of governments, organizations, and businesses • basis for allocating funds or determining major expenditure • aid to understanding the nature of ongoing changes and their implications • Federal, state, and local governments use them to establish electoral boundaries, to plan service delivery, and to determine the need for various types of public facilities. • Business use population estimates to develop consumer profiles, to choose sites for new stores or branch offices, and to identify under-served markets. • Researchers use them as rate denominators and to study social trends, environmental conditions, and geographic movements. • difficult to complete with accuracy for small areas because small areas can grow or decline rapidly, or even undergo substantial changes in age, sex, and race/ethnicity, and other demographic characteristics.
Population Estimates • Two types of estimates: • Intercensal - estimates computed between two censuses, such as 2000 to 2010; • Postcensal - estimates for dates after the most recent census.
Principles of Population Estimates and Projections An estimate or projection is as accurate as the assumptions on which it is based No specific methodology guarantees accuracy Estimates and Projections usually are more accurate for: • Areas with large populations • Total population • Shorter time periods • Areas with slow or stable growth patterns
Factors Limiting Estimation and Projection Procedures and Uses • Data Availability and Quality (Data Adjustments) • Changes in Areal Boundaries • Changes in Definitions • Coverage Errors (undercount or overcount)
Common Data Adjustments Required in Population Estimation and/or Projection • Adjusting period of estimate or projection from Census date (April 1) to estimate or projection date (such as July 1) • Deriving values for parts of years from annual data (usually simply assume linear rate of occurrence; e.g., ¼ births occur by April 1, ½ by July 1, etc.) • Adjust values of indicators for a jurisdictional area to be consistent with a Census area (e.g., adjusting data for school districts to be consistent with place boundaries) • Using averages of vital occurrences to increase the stability of rates for small areas
Estimation Methods Extrapolative Techniques • Arithmetic • Geometric • Exponential Symptomatic Techniques • Housing Unit Method • Electric Meter Method • School Enrollment Method • Simple Ratio Method • Vital Rates method • Composite Method • Proration Method Regression-Based Techniques • Ordinary Least Squares • Ratio-Correlation Component Techniques • Cohort Survival Method • Component Method II • Administrative Records Method
Extrapolative Techniques • Techniques – use data on past trends in rates (or ratios) of population change to estimate total population • Only data requirement is for data on total population of estimate areas for at least two points in time • Easy to use but fail to take into account • Changes in population structure • Changes in component process (i.e., trends in births, deaths and migration)
Growth Models Geometric Exponential
Arithmetic Rate of Change Data Requirement Total population counts or prior estimates for two or more previous time periods Major Assumptions Historical pattern of change applies to current measurement period Population increase or decrease by the same number each year, (i.e., fixed numerical change)
Estimates of Population Based on Arithmetic Growth Rate, 2000-2010
Geometric Rate of Change Data Requirement Total population counts or prior estimates for two or more previous time periods Major Assumptions Population change varies by fixed time intervals Historical rate of change applies to current measurement period
Estimates of Population Based on Geometric Growth Rate, 1990-2000
Exponential Rate of Change Data Requirement Total population counts or prior estimates for two or more previous time periods Major Assumptions Population change occurs on a continuous basis (i.e., a continuous rate) Historical rate of change applies to current measurement period
Estimates of Population Based onExponential Growth Rate, 2000-2010
Estimates for July 1, 2011 Census Bureau Estimate 25,674,681 Arithmetic Estimate 25,682,279 25,741,022 Geometric Estimate 25,741,035 Exponential Estimate
Symptomatic Methods Use data on a factor (symptom) thought to vary with population to estimate population Data Requirement Value of symptom for areas of interest for known date (usually last census) Population value for areas of interest for known date (usually last census) Value of symptom for areas of interest for estimate date Major Assumptions Assumes relationship between symptom and population remains consistent or changes in a known pattern over time
Censal-Ratio Method Using Housing Permits Data Requirement Measure of persons per household at estimate date Count of occupied housing units at estimate date (which includes use of prior census data and housing permits since census) Major Assumptions Assumes housing change is symptomatic of population change
Censal-Ratio Procedure with Housing Permit Date: Estimate of Population
Censal-Ratio Method Using Electric Meter Counts Data Requirement Measure of persons per electric meter Accurate count of active residential meters Major Assumptions Assumes the change in meter counts is symptomatic of population change
Censal-Ratio Method Using Electric Meter Billing: Estimate of a city
Step 3. Determine the ratio of population per meter of the last census date (adjusting for annexations if applicable): 55,002 ÷ 20,547 = 2.6769 Step 4. Obtain the current number of active meters adjusting for vacant housing units with active meters, multi-family units using master meters, and annexations since the census date. The local electric/power company can provide this data for the month desired for the estimate date. Active residential electric meter billings on April 1, 2002: 20,944 Step 5. Calculate the total population by multiplying the number of active meters on the estimate date by the ratio of population per meter: 20,944 x 2.6769 = 56,065 Information on number of vacant units which had active electric meters is often not available. Utilities representatives may be able to provide an estimate.
Potential Refinements in Use of Housing Unit/Electric Meter Methods (Smith, 1986) • Separate estimates by housing type (single-family, multiple-family, mobile homes and group quarters) • Use of current surveys to establish average household size and occupancy rates • Use of average o f multiple estimates made using building permits, electric meters, telephone connections, etc. • Use of ratios of indicators to total population rather than using change in indicators as a symptom of change in housing
School-Enrollment Ratio Method Data Requirement School enrollment, grades 2-8, for area of interest and for nation at a prior time and at estimate date Total population for area of interest and for nation at a prior time period and national population on estimate date Major Assumptions Assumes that the ratio of age-specific school enrollment relative to total population remains comparable between U.S. and area of interest at any point in time
School-Enrollment-Ratio Method Used to Estimate Population for Bexar County, 2006 Bexar County 1. Census Population (April 1, 2000) 1,392,931 2. School Enrollment, Grades 2-8 (April 1, 2000) (Public and Private) 11 177,072 3. School Enrollment Ratio (2) ÷ (1) = 3 0.127 B. Texas 4. Total Population, 2000 (April 1, 2000) 20,851,820 5. School Enrollment, Grades 2-8 (November, 2000) 2,617,210 6. School Enrollment Ratio (5) ÷ (4) = 6 0.126 7. Total Population (July, 2006) 23,507,783 8. School Enrollment, Grades 2-8 (November 2006) 2,862,839 9. School Enrollment Ratio (November 2006) (8) ÷ (7) = (9) 0.122 C. Bexar County 10. Estimated School Enrollment Ratio (November, 2001 - April, 2006) [(9) ÷ (6)] x (3) = (10) 0.123 11*. School Enrollment, Grades 2-8 (November, 2001 - April, 2006) (Public and Private) 193,282 12. Estimated Population for April, 2006 (11) ÷ (10) = (12) 1,571,398 Public school enrollment was derived after partialing out those students who were bused into the school district from outside city boundaries. It was assumed that this proportion remained constant between 2000 and 2006.
Simple Ratio Technique Uses trends in ratios for multiple symptoms to estimate population
Simple Ratio Technique Data Requirement Data on indicators (symptoms) for known period and estimate date Major Assumptions Change in ratios for symptoms indicative of change in population
To estimate population of Bexar County for 2006 Given: Population of Bexar County in 2000 = 1,392,931 Births in Bexar County in 2000 = 24,033 Births in Bexar County in 2006 = 26,471 Deaths in Bexar County in 2000 = 10,184 Deaths in Bexar County in 2006 = 10,630 Example of Simple Ratio Technique
Vital Rates Method Uses crude vital rates for subarea and superarea and trends in rate for superarea to estimate population in subarea
Vital Rates Method Data Requirement Vital events for subarea for known period of time (usually census year) and estimate year Vital rates for subarea for known period of time Vital rate for superarea for known period of time and estimate date Major Assumptions Change in vital events symptomatic of change in population Change in vital rate from known date to estimate date for subarea is equal to the change for the superarea
Proration (To obtain estimate for subarea from data for “super” area) Data Requirement Estimate for “super” area for estimation date Ratio of subarea to superarea population for a period (usually most recent census) Assumption Historical ratio between subarea and superarea population remains the same or change in a known way
Example of Proration Method To estimate population of Bexar County for 2006 Given: Population of Bexar County in 2000 = 1,392,931 Population in Texas in 2000 = 20,851,820 Population Estimate for the State in 2006 = 23,507,783