Download
1 / 25
320 likes | 1.07k Vues
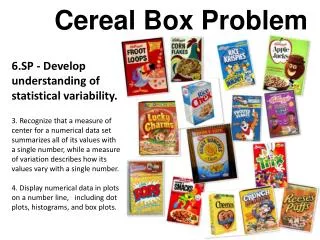
Group the following as either discrete or continuous data. Speed of a car. Population of a town. Volume of a cereal box. Length of a crocodile. Shirt collar size. Discrete? Continuous?. Number of goals in a season. Number of matches in a box. Temperature of oven. Discrete. Continuous.

E N D
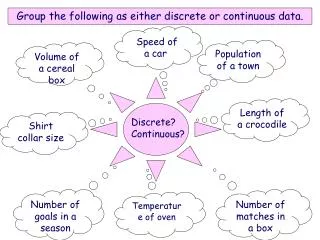
Group the following as either discrete or continuous data. Speed of a car Population of a town Volume of a cereal box Length of a crocodile Shirt collar size Discrete? Continuous? Number of goals in a season Number of matches in a box Temperature of oven
Discrete Continuous Population of a town Volume of a cereal box Number of matches in a box Top speed of a car Length of a crocodile Shirt collar size Number of goals in a season Temperature of oven
Learning objectives:To be able to design frequency tables for discrete raw data; and design data collection tables for gathering large discreteand continuous sets of raw data, choosing suitable class intervals. Date: 04/06/2013 Title: Recording data in tables
Discrete and continuous data Numerical data can be discrete or continuous. Discrete data can only take certain values. For example, shoe sizes, the number of children in a class, the number of sweets in a packet. Continuous data comes from measuring and can take any value within a given range. For example, the weight of a banana, the time it takes for pupils to get to school, the height of 13 year-olds.
Designing a data collection sheet age sex height (cm) weight (kg) hours of TV watched per week A data collection sheet can be used to record data that comes from counting, observing or measuring. It can also be used to record responses to specific questions. For example, to investigate a claim that the amount of TV watched has an impact on weight we can use the following:
Using a tally chart favourite snack tally frequency crisps fruit nuts sweets When collecting data that involves counting something we often use a tally chart. For example, this tally chart can be used to record peoples’ favourite snacks. 13 6 3 8 The tally marks are recorded, as responses are collected, and the frequencies are then filled in.
Grouping data A list of results is called a data set. It is often easier to analyze a large data set if we put the data into groups. These are called class intervals. A frequency diagram or histogram can then be drawn. You will need to decide on the size of the class interval so that there are roughly between 5 and 10 class intervals. What is the best size for the class intervals for the race times data?
Grouping discrete data 34p £1.72 83p £6.36 £4.07 £2.97 £3.53 6p £9.54 34p £1.68 50p 82p £7.54 £1.09 £2.81 £2.43 46p £1.70 £1.29 A group of 20 people were ask how much change they were carrying in their wallets. These were their responses: Each amount of money is different and the values cover a large range. This type of data is usually grouped into equal class intervals.
Choosing appropriate class intervals For the following data: 34p £1.72 83p £6.36 £4.07 £2.97 £3.53 6p £3.54 34p £1.68 50p 82p £7.54 £1.09 £2.81 £2.43 46p £1.70 £1.29 When choosing class intervals it is important that they include every value without overlapping and are of equal size. We can use class sizes of £1: £0.01 - £1.00, £1.01 - £2.00, £2.01 - £3.00, £3.01 - £4.00, £4.01 - £5.00, Over £5. This is an open class interval.
Choosing appropriate class intervals 34p £1.72 83p £6.36 £4.07 £2.97 £3.53 6p £3.54 34p £1.68 50p 82p £7.54 £1.09 £2.81 £2.43 46p £1.70 £1.29 The size of the class intervals depends on the range of the data and the number of intervals required. For the following data: Explain why class sizes of £5 would be inappropriate. Could we use a class size of 20p?
Grouping continuous data Length (cm) Frequency Length (cm) Frequency 0 < length ≤ 10 0 ≤ length < 10 10 ≤ length ≤ 20 10 ≤ length < 20 20 ≤ length ≤ 30 20 ≤ length < 30 30 ≤ length 30 ≤ length Continuous data is usually grouped into equal class intervals. What is wrong with the class intervals in this grouped frequency table showing lengths? This is an open class interval.
class intervals 88.491.592.193.393.994.795.0 95.395.5 95.695.696.396.596.997.097.097.097.3 97.497.497.797.898.098.298.298.498.4 98.598.999.099.199.699.699.8100.0 100.6 100.6101.1101.4101.4101.5101.6101.6101.8101.9 102.1102.5102.6102.7103.1103.1103.1104.1105.0 105.2105.6105.6105.7105.8105.9 The times roughly range from 85 to 110 seconds. 110 – 85 = 25 seconds. Suppose we decide to use class intervals with a width of 5 seconds. 25 ÷ 5 = 5 class intervals
Notation for class intervals How should the class intervals be written down? What is wrong with this table?
Times in seconds Times in seconds Frequency 85 – 90 but not including 90 85 ≤ t < 90 90 ≤ t < 95 95 ≤ t < 100 100 ≤ t < 105 105 ≤ t < 110 Notation for class intervals Can you explain what the symbols in the middle column mean? 90 – 95 but not including 95 95 – 100 but not including 100 100 – 105 but not including 105 105 – 110 but not including 110
Notation for class intervals 85 ≤ t < 90 means “times larger than or equal to 85 seconds and less than 90 seconds” Another way to say this is “from 85 up to but not including 90” Can you say these in both ways? 1) 90 ≤ t < 95 “times larger than or equal to 90 seconds and less than 95 seconds” or “from 90 up to but not including 95”. 2) 105 ≤ t < 110 “times larger than or equal to 105 seconds and less than 110 seconds” or “from 105 up to but not including 110”.
Times in seconds Frequency 85 ≤ t < 90 90 ≤ t < 95 95 ≤ t < 100 100 ≤ t < 105 105 ≤ t < 110 Class intervals 88.491.592.193.393.994.795.0 95.395.5 95.695.696.396.596.997.097.097.097.3 97.497.497.797.898.098.298.298.498.4 98.598.999.099.199.699.699.8100.0 100.6 100.6101.1101.4101.4101.5101.6101.6101.8101.9 102.1102.5102.6102.7103.1103.1103.1104.1105.0 105.2105.6105.6105.7105.8105.9 Use the data to fill in the table.
Times in seconds Frequency 85 ≤ t < 90 90 ≤ t < 95 95 ≤ t < 100 100 ≤ t < 105 105 ≤ t < 110 Class intervals: Answer 88.491.592.193.393.994.795.0 95.395.5 95.695.696.396.596.997.097.097.097.3 97.497.497.797.898.098.298.298.498.4 98.598.999.099.199.699.699.8100.0 100.6 100.6101.1101.4101.4101.5101.6101.6101.8101.9 102.1102.5102.6102.7103.1103.1103.1104.1105.0 105.2105.6105.6105.7105.8105.9 1 Use the data to fill in the table. 5 28 19 7
Team Worker Creative Thinker Effective Participator Independent Enquirer Reflective Learner Self Manager Which ones are you using? PLT Skills Learning objectives review To be able to design frequency tables for discrete raw data; and design data collection tables for gathering large discreteand continuous sets of raw data, choosing suitable class intervals. . I don’t understand I nearly understand I fully understand
Team Worker Creative Thinker Effective Participator Independent Enquirer Reflective Learner Self Manager Learning Objectives: To be able to design frequency tables for discrete raw data; and design data collection tables for gathering large discreteand continuous sets of raw data, choosing suitable class intervals. Assessment - Join up with another pupil. Discuss your answers to the task. - Have you both got the same answers? If not why? What level am I working at?
Level 6 The possible answers are likely to range from 0 to 100, so you might draw a tally chart with groupings similar to the one below:
Level 7 You are investigating the length of time each member of a class spends on the internet per week. Look at the class groupings below - do you think they are right? These groups are wrong, because the times of '10 hours' and '20 hours' can be entered into two different groups. For example, the time 10 hours can be entered into 0 ≤ time ≤10 (where time is less than or equal to 10 hours), and also into 10 ≤ time ≤ 20 (where time is more than or equal to 10 hours).
Level 7 These groups are also wrong, because the times '10 hours' and '20 hours' cannot be entered into any of the groups.For example, the time 10 hours can neither be entered into 0 < time < 10 (where time is less than 10 hours), nor can it be entered into 10 < time < 20 (where time is more than 10 hours). These groupings are right. '10 hours' is included in the second group, but not the first and '20 hours' is included in the third group, but not the second.
Team Worker Creative Thinker Effective Participator Independent Enquirer Reflective Learner Self Manager Which ones are you using? PLT Skills Learning Objectives: To be able to design frequency tables for discrete raw data; and design data collection tables for gathering large discreteand continuous sets of raw data, choosing suitable class intervals. Individual Assessment WWW (What Went Well) EBI (Even Better If) On your post it notes… Think about how you can improve your work.
Team Worker Creative Thinker Effective Participator Independent Enquirer Reflective Learner Self Manager On your post it.. think about WWW (What did you enjoy in today's lesson?) EBI (This lesson would have been better If…)