Download
1 / 15
150 likes | 354 Vues
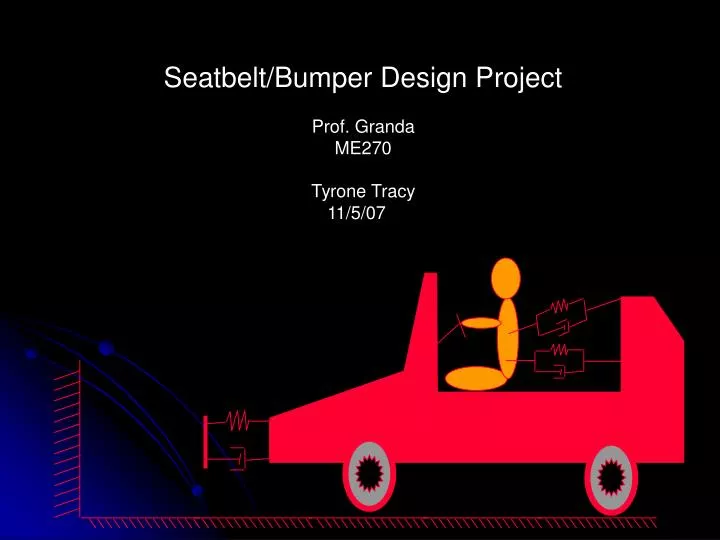
Seatbelt/Bumper Design Project Prof. Granda ME270 Tyrone Tracy 11/5/07 . Assignment A car will crash into a wall going from 25 to 55 MPH. Design the seatbelts and bumper so that the crash dummy will survive the collision.

E N D
Seatbelt/Bumper Design Project Prof. Granda ME270 Tyrone Tracy 11/5/07
Assignment • A car will crash into a wall going from 25 to 55 MPH. Design the seatbelts and bumper so that the crash dummy will survive the collision. • Develop a bond graph model of the car, person, seatbelts, bumper. Simulate system performance using Matlab/Simulink. • Injury data and physical parameters provided. • Goals • Develop model for the crash system. • Change the initial seatbelt/bumper values so that the dummy will survive the crash. • Obtain plots to prove design’s worthiness. • Results • The initial values for the bumper and seatbelts did not result in the dummy surviving. • The values were changed so now the dummy will survive the crash going from 25-61MPH. Exact values provided throughout the report.
Step 1: Develop a bond graph model C = compliance I = inductive R = resistive Dummy | Seatbelt Wall---Bumper---Car
Step 2: Interface CAMPG with Matlab. Change values in campgmod.m to match systemparameters. Initial conditions (mph changed to m/s) Given initial physical parameters mdummy= 100 kg k1= 1 x 10⁴ N/m, b1=500 N-s/m Mcar= 1500 Kg, k2= 3 x 10⁵ N/m, b2=8 x 10⁴ N-s/m Plotting graphs to interpret results
Plot: Using given physical parameters and initial velocity set to 25MPH. • The dummy is only allowed to move 100cm (1m) before he is deemed injured. Thegraph below shows that the peak distance traveled by the dummy is about .75m, so he is safe in that regard. • The dummy can only feel 6670N on his chest before he is injured, the plot below shows that the dummy feels more than 6670N so he is injured.
Plot: Using given physical parameters and initial velocity set to 55MPH. • The graph below shows that the peak distance traveled by the dummy is about 1.8m, so the dummy has collided with the windshield. • The dummy feels 1800N on his chest , so he is not injured by the seatbelt.
Step 3: Using loops, determine the values for the bumper and seatbelt so that the resulting plots will show that the dummy is not injured. My design values mdummy= 100 kg k1= 30000 N/m, b1=300 N-s/m Mcar= 1500 Kg, k2= 1000000 N/m, b2= 10000 N-s/m
Plot: Using my new physical parameters and initial velocity set to 25MPH. • The graph below shows that the peak distance traveled by the dummy is about .4m, so the dummy is safe. • The plot below shows that the dummy feels about 1200N of force and since that is less than 6670N he is not injured.
Plot: Using my new physical parameters and initial velocity set to 55MPH. • The graph below shows that the peak distance traveled by the dummy is about .8m, so the dummy is safe. • The plot below shows that the dummy feels about 2500N of force, since that is less than 6670N he is not injured.
Step 4: Now we must see how adding an additional shoulder strap to the dummy could affect the dummy’s safety. To model 2 safety belts instead of one, I will doublethe value of the K and B element. The dummy’s force tolerance doubles since the effective area increases; the value increases from 6670N to 13340N. 25MPH SAFE 55MPH
Step 5: How long it would take the dummy to hit the windshield if he were not wearing a seatbelt? To model this situation I set the R value to 0 and the K value very high, meaning that the C (potential energy stoarage, ie seatbelt) element becomes very small. 25MPH. Dummy hits the windshield inabout .1 seconds. 40MPH. Dummy hits the windshield inabout .075 seconds. 55MPH. Dummy hits the windshield inabout .055 seconds.
Step 6: I want to see what velocity the car could go and still have the dummy be safe after the collision. To test this I simply entered in different velocity values until I saw either the distance traveled greater than 1m or the force on the dummy’s chest greater than 6670N. I used the physical parameter values of my design. My design is limited by the distance traveled by the dummy.The critical velocity with these physical parameter values is 61mph.
Step 7: To validate that the Matlab program was simulating correctly, we double check with a Simulink simulation. To do this we need the step response of our system in matlab, which means we have to uncomment the e11 and f8 equations in the campgnum.m file. The plots from Simulink match the one from Matlab.
Conclusions • We were given a scenario of a car crashing into a wall with a dummy riding inside. One of the goals was to develop a bond graph model and a Matlab simulation of this system. We used CAMPG and Matlab to model and simulate this scenario. • The physical parameters given to us initially were not suffice to keep the dummy safe. Another goal was to obtain new seatbelt/bumper compliance and resistive numbers to keep the dummy safe from 25-55MPH. With my new design values, the plots shows that the dummy was safe up until a critical velocity of 61MPH. • Simulink was used to show that the Matlab simulations were valid.
Problems • My plots (that used the initial physical parameters) don’t match many of my classmates plots, even though our bond graph models are the same. This makes me think that there may be something wrong with my Matlab interface. • If you inspect the plots on slide 5 and slide 6, you can see that the dummy feels more force on his chest going 25MPH than 55MPH. That physically doesn’t make sense to me. • So I redid these simulations several times, each time starting from a brand new campG model. I also tried switching computers and redoing the Matlab code, every attempt resulted in the same plots. I would like to see the Professor’s solution to this design project, and get an explanation of why my results turned out the way they did (they may be correct, I’m unsure).