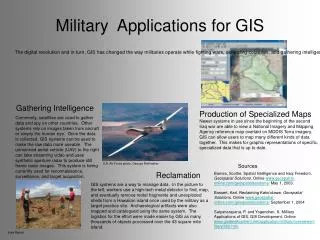
Customized GIS Applications for Electric Distribution Utilities: Enhancing Operations and Maintenance
This presentation explores tailored GIS applications created for HENDRICKS POWER COOPERATIVE in Indiana, focusing on improving electric distribution utilities' efficiency and reliability. Key applications include the analysis of momentary power interruptions (Blinks), voltage monitoring, a switch map for improved operational decision-making, and tools for field inspections of electrical equipment. Each application leverages advanced GIS techniques and data analytics to enhance real-time decision-making, maintenance operations, and service reliability in electric distribution.

Customized GIS Applications for Electric Distribution Utilities: Enhancing Operations and Maintenance
E N D
Presentation Transcript
Customized gis applications for Electric DISTRIBUTION Utilities ROXY GIUSCA, PhD, GISP HENDRICKS POWER COOP, INDIANA
Applications presented: 1. Blinks 2. Voltage 3. Switch Map 4. Field Inspections on Electric Equipment 5. Outages Dashboard
1. Blinks • Blinks = momentary interruptions of power • When the lights blink means that the electric utility's equipment is functioning properly. Blinks are the result of momentary interruptions on the line. These short interruptions can be caused by small animals, birds, trees, vehicle accidents or lighting strikes making contact with an energized power line. • SCOPE: • To create a visual way to see the blinks daily and stored for a month; • Correlate blinks with outage data • Identify the Recloser (protective device) which operates in case of a line is blinking • MAIFI Chart analyses • Store the count/service in a separated database for year and compare multi annual data
Blinks. Data Source • NISC tables for CIS and OMS through ODBC connection • TWACS tables through ODBC connection • Algorithms to extract the current count between daily readings • Task that runs automatically the process every morning
Blinks. Technology • ArcMap, ArcToolbox, Python Scripts
Correlating and Analyzing Data • We look into the Outage data, SCADA Information and other events such as maintenance work on the line etc • Outages for the past 48 hours are displayed on the map
Looking into current data and historical data for different services to identify the cause of the blinks
In the previous example only C Phase services had blinks, so we look back to the protective device upstream
Customized Tools • We created couple customized tools in Python and also added them as a dedicated toolbar for the blinks
Blinks. MAIFI Index • MAIFI is a calculation of the average frequency of momentary interruptions. Its formula is the total number of customer momentary interruptions divided by the total number of customers served(www.smartgridlibrary.com) • We used the number of Blinks per substation/number of total members of substation; the value should be 1 or < 1 to be good. If higher than 1, it requires attention.
Blinks. Automated process • Windows Task are schedule to run macros for Blinks, MAIFI, Annual blinks and send an email when the process is completed.
2. VOLTAGE • Scope: to identify the high and low voltage at the meter level and display it on the map • Data is structured for ranges at the system level and based on absolute values per feeder • Custom algorithm behind of it to extract the counts from Proasys which shows a snapshot of the Voltage at a specific time and nominal value % or phase to phase • Good accuracy for single phase accounts • View of the Voltage data for the full system: Blue dots are high voltage and red dots are low voltage. • Operations department follow up on data and check the meters for each individual after the concept was initially proved for some meters.
VOLTAGE • TOC for Voltage data per feeder and also view of these on the map
3. SWITCH MAP • OBJECTIVES: To give an option to the line crew to visualize the available options in SCADA for the inside employees to switch from one feeder to another one Better sync between the field work and office employees (Operations Department) A map that works in OMS –Outage Graphics, NISC Enterprise AppSuite The other maps are too rich in information and hard to visually process the connections between one feeder and the ones available to connect to (back feed purposes) Not all the protective devices have an impact in switching scenarios Poles, secondary lines, transformers, services etc have no relevance in switching
SWITCH MAP - details • Created a simple/minimal map which contains: • All three phase lines, all colored different by feeder and labeled with the feeder number • All Primary single phases colored the same • Extracted only the Reclosers from the overcurrent devices feature class. If the Reclose is 3 phase, it is labeled as “ABC”. If it is single phase, it is not labeled with phase info. • Open Reclosers also contain an “Open” label on top. • All switches are labeled with “Open” if they are open and a different color than the closed switches. • For a faster spatial reference, we created bookmarks using the list from SCADA with all the switching options. • If the switching is between two feeders which belong to different substations, then the bookmark zooms to the extent where the user can see the substation, the 3 phase lines colored differently/feeder. Then the user zoom-s in at the intersections of the feeders.
Zoom-in to the Danville Substation (N) and Stilesville Substation (S)
4. Field INSPECTIONS • There are types of equipment the require regular inspections, such as electric poles, three phase meters, street lights etc • Hendricks Power is using for inspections NISC Mapping technology available on desktops/laptops and also mobile (iPads). The process starts in the office where the GIS Specialist is exporting the data from the map that will be inspected and created the inspection form.
Field Inspections • There are fields that are transferred from the GIS attribute table of the features and also fields that can be added/customized for the inspection only. • Data is saved in a database dedicated to inspections and which is hosted on the GIS Server. • The Inspector syncs his NISC AppSuite Inspection form on the ipad with the one from the server and the process starts.
Field Inspections • The inspections can be ad-hoc, when the inspector can just edit existing features on the map or defined inspections, when the data is defined by being selected and exported from the Desktop version of software to the ipad and a form is associated with. • Back in the office, the inspector syncs his data again and the GIS Specialist will receive it almost in real time.
What questions do you have? • Thank you!