Download
1 / 23
230 likes | 339 Vues
This project focuses on a detailed regional drought monitor providing stakeholders with actionable insights to manage water resources effectively. It includes data analysis, triggers for low inflow periods, and comparison with existing indices for better decision-making.

E N D
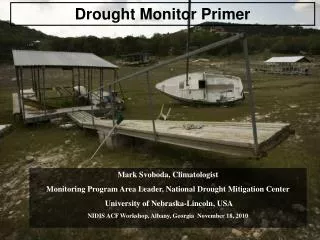
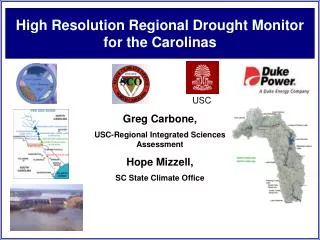
USC High Resolution Regional Drought Monitor for the Carolinas Greg Carbone, USC-Regional Integrated Sciences Assessment Hope Mizzell, SC State Climate Office
Background • Drought historically monitored on regional and statewide spatial scales • Drought data readily available at • climate division scale or larger • 1998-2002 Southeastern US Drought amplified belief among climate scientists and policy makers that drought depiction and measurement is required on more local scales
Dam Relicensing • Federal Energy Regulatory Commission (FERC) has jurisdiction over all hydropower dams not owned by federal government. • Rivers are owned by public. • Developer may obtain license to dam river for purpose of hydropower generation. • Licenses last 30 to 50 years • Relicensing process gives stakeholders an opportunity to reconsider appropriate operations and land management for each project, taking into account current social and scientific knowledge. • FERC • State and federal resource agencies • Conservation groups • General public
FERC Projects: - 2,500 non-federal hydropower projects - 220 FERC hydropower licenses will expire this decade (one-third of FERC hydropower capacity)
Catawba-Wateree Project • 11 Interconnected Reservoirs • 2 states, 14 counties, 30 municipalities • Regional and National profile • Lasting impact to both NC and SC
Agencies and Interests in the FERC Relicensing Process Federal Agencies Licensee Non-Agency Stakeholders State Agencies
Study Groups Water Quality Water Supply Hydropower Recreation Fish and Wildlife and Habitat Enhancement and Protection Shoreline Management
Duke Consulting Studies Open Comment Period FERC Review & Relicensing
SC Governor’s Water Law Review Duke Consulting Studies Open Comment Period El Nino SC Drought Act FERC Review & Relicensing Ad Hoc NC/SC Water Agreement
Low Inflow Protocol • Existing license does not address operation during low inflow periods. • LIP establishes procedures for managing available water supply. • Major elements include 3 triggers and response stages Success of LIP depends on diagnostic accuracy of trigger points, and effectiveness of Licensee and water users in working together to implement their required actions to achieve significant water use reductions. • Additional considerations include • Consistency between Catawba and Yadkin LIP • Consistency with SC Drought Response Act • Double regulations and requirements
Stage Storage Index 1 Drought Monitor 2 (3-month average) Monitored USGS 3 Streamflow Gages 04 90% < SI < TSI 0 ≤ DM AVG ≤ 85% 1 75% < SI ≤ 90%TSI 1 ≤ DM AVG ≤ 78% 2 57% < SI ≤ 75%TSI 2 ≤ DM AVG ≤ 65% 3 42% < SI ≤ 57%TSI 3 ≤ DM AVG ≤ 55% 4 SI ≤ 42%TSI DM = 4 AVG ≤ 40% Catawba-Wateree Project Summary of LIP Trigger Points AND OR 1 Ratio of Remaining Useable Storage to Total Usable Storage 2 3-month numeric average of U.S. Drought Monitor 3 Sum of rolling 6-month average streamflow as percentage of period of record rolling average for same 6-month period 4 Stage 0 is triggered when any two of three trigger points are reached
High Resolution Regional Drought Monitor • To provide local scale drought monitoring tool • Compute suite of monthly drought indices, 1950-2004. • Empirical probability distributions of each index to allow stakeholders to create drought blends that address specific sensitivities to drought. Palmer Drought Severity Index (PDSI) Palmer Hydrological Drought Index (PHDI) Palmer Z Index Standardized Precipitation Index (1,2,6,9,12,24-month) Precipitation (1,3,6,12,24,60-month) 7-day Streamflow 14-day Streamflow Streamflow (1,3,6,12,24-month)
D4 D3 D2 D1 D0
Stage Storage Index 1 Drought Monitor 2 (3-month average) Monitored USGS 3 Streamflow Gages 04 90% < SI < TSI 0 ≤ DM AVG ≤ 85% 1 75% < SI ≤ 90%TSI 1 ≤ DM AVG ≤ 78% 2 57% < SI ≤ 75%TSI 2 ≤ DM AVG ≤ 65% 3 42% < SI ≤ 57%TSI 3 ≤ DM AVG ≤ 55% 4 SI ≤ 42%TSI DM = 4 AVG ≤ 40% Catawba-Wateree Project Summary of LIP Trigger Points AND OR 1 Ratio of Remaining Useable Storage to Total Usable Storage 2 3-month numeric average of U.S. Drought Monitor 3 Sum of rolling 6-month average streamflow as percentage of period of record rolling average for same 6-month period 4 Stage 0 is triggered when any two of three trigger points are reached
Catawba-Wateree Streamflow vs. Storage Index Comparison 1953-2003 (Highest LIP stage according to Streamflow and Reservoir Storage)
Catawba-Wateree Proposed Triggers (During 2002 Record Drought)
US Drought Monitor vs Regional Drought Monitor • Pros: • Produced weekly by NOAA and USDA • Incorporates quantitative indicators with input from experts • “Fujita” or “Saffir-Simpson” type classification system for drought • Uses percentile approach in determining severity thresholds • Subjective adjustments based on local impacts • Gained popularity among media, state and local officials • Cons: • Cannot regenerate historical values because local input not available • Intended to display broad areas of dryness • New Tool 1999-Present • Difficult to compare with traditional drought indicators • Use indicator that has a consistent long-term record (Steinman et al. 2005, Keyantash and Dracup, 2002).
Trigger Points Still Underdevelopment Storage Index Drought Monitor Streamflow (3 month vs. 6 month) Yadkin-Pee Dee Relicense • Yadkin-Pee Dee Project • 6 Reservoirs • 2 states, 24 counties, 83 municipalities • Ran out of water 2002 • Lasting impact to both NC and SC
Conclusions / Future Results • Drought Triggers are Tools to Aid Decision-Makers • LIP Creates a Drought Management Advisory Group (DMAG) • Working with Licensee when LIP is initiated • Meet as necessary to foster basin-wide response to LIP • Meet annually during May, to review prior year activities, discuss data input from Large Intake Owners, and discuss other issues relevant to LIP • Substitution of a Regional Drought Monitor for U.S. Drought Monitor are examples of items that may be re-evaluated • Evaluation of Triggers Listed in SC Drought Response Act Regulations