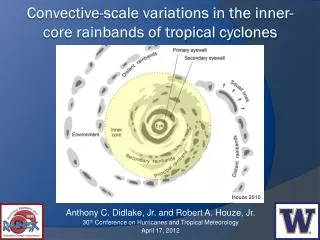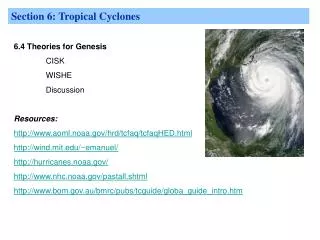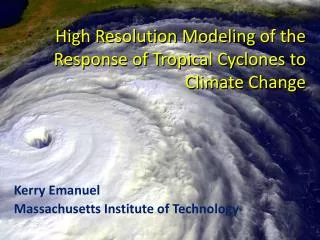
Section 6: Tropical Cyclones
Section 6: Tropical Cyclones. 6.4 Maximum Potential Intensity How intense can a tropical cyclone get? Resources: Emanuel 1991 “The theory of hurricanes”, Annual. Rev. Fluid Mech., 23: 179-196 http://wind.mit.edu/~emanuel/holem/holem.html.

Section 6: Tropical Cyclones
E N D
Presentation Transcript
Section 6: Tropical Cyclones 6.4 Maximum Potential Intensity How intense can a tropical cyclone get? Resources: Emanuel 1991 “The theory of hurricanes”, Annual. Rev. Fluid Mech., 23: 179-196 http://wind.mit.edu/~emanuel/holem/holem.html
Section 6.4 Maximum Potential Intensity: The Carnot Cycle See Notes
Section 6.5 Maximum Potential Intensity: Discussion • Why is the observed P usually less than the MPI from theory? • The theory is very idealised • There exist negative feedbacks in the system (SST-feedback?) • Interactions with large-scale flow (vertical shear, dry intrusions)
Section 6.5 Maximum Potential Intensity: Discussion There has been a lot of recent interest in the role of the Saharan Air Layer (SAL) in delaying intensification See: http://cimss.ssec.wisc.edu/tropic/real-time/wavetrak/sal-background.html
Section 6.5 Maximum Potential Intensity: Discussion See: http://wind.mit.edu/~emanuel/holem/holem.html This includes an alternative derivation of MPI where Q1 and Dissipation are explicitly estimated – such terms involve surface flux estimates. Here the square of the maximum wind speed is proportional to Ck/Cd where Ck is the drag coefficient for enthalpy (related to thetae) and Cd is the drag coefficient for momentum. See also real time maps of MPI
Section 6.5b Genesis Potential Index Empirical approach to quantify the effects of large-scale environment on tropical cyclogenesis; following Gray (1979) Useful for attribution of various factors and weighting their importance Useful possibly for prediction, supposing that large scale is more predictable than TC-scale; especially in climate models Various parameters were considered but no thresholding based on the present climate (e.g. SST=26C, cf Gray (1979)) Initial list included: MPI, RH, Abs. Vort., and wind shear (between 850mb and 200mb). Vpot comes from MPI-type calculations based on Carnot Theory Using NCEP reanalysis data and best-track locations for genesis the index is:
Section 6.5b Genesis Potential Index Abs. vort is at 850mb, H is RH at 600mb Curve Fitting – No Physics in the assumptions (but maybe in the results!) Main difference with Gray is in the thermodynamic parameters; here there is Vpot which is based on air-sea thermodynamic disequilibrium and includes SST information.
Section 6.5b Genesis Potential Index Climatological values Generally good Quantitatively not so good FEB SEP
Section 6.5b Genesis Potential Index Annual Maximum in each grid-point
Section 6.5b Genesis Potential Index Good representation of seasonal cycle BUT the index was tuned to fit the climatological spatial patterns and these annual cycles. No basin-specific tuning. All basins are reasonably well captured though.
Section 6.5b Genesis Potential Index In El Nino years: More activity in E Pac Less activity in Atlantic Shift of activity in W Pac
Section 6.5b Genesis Potential Index Vorticity E Pac: wind shear is the main contributor to the ENSO genesis potential anomalies, with PI also playing a role (vort and RH in opp. sense!) Atlantic: RH is most important (variable we have least confidence in!), wind shear also has a role (PI and vort less impt) West Pac: Neg anomaly near Asian continent, mainly due to RH, also contribution from PI. Increase near dateline is mainly due to vort., with contributions from shear and RH Shear PI RH
Section 6.5b Genesis Potential Index • Camargo et al (2007) “Tropical cyclone genesis potential index in climate models, Tellus, 59A, 428-443 • Examined the index in 5 GCMs run with historical SSTs over multidecadal period: • observed seasonal cycle good • most have a higher GP • each model has its own relationship between GP and “TC” activity • GP is sensitive to horizontal resolution of the model