
range.
E N D
Presentation Transcript
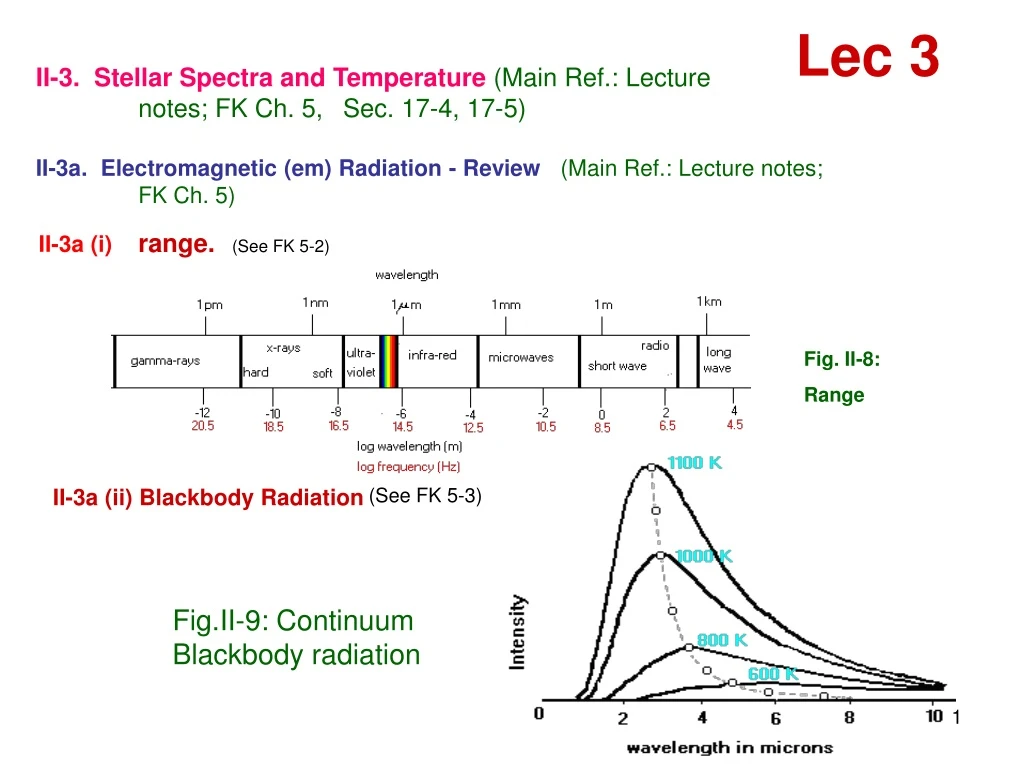
Lec 3 II-3. Stellar Spectra and Temperature(Main Ref.: Lecture notes; FK Ch. 5, Sec. 17-4, 17-5) II-3a. Electromagnetic (em) Radiation - Review(Main Ref.: Lecture notes; FK Ch. 5) II-3a (i) range. (See FK 5-2) . Fig. II-8: Range II-3a (ii) Blackbody Radiation (See FK 5-3) Fig.II-9: Continuum Blackbody radiation
II-3a (iii) Spectrum (See FK 5-2, 5-5, 5-6, 5-7, 5-8) Fig. II- 10a: Rainbow Angstroms Å Å = 1010 m = 0.1 nm. 1 nm = 109 m Fig.II-10b: Spectrum-continuum and absorption lines The rainbow is a natural spectrum caused by the refraction and reflection of sunlight through raindrops, and shows that sunlight consists of a continuous run - - a continuum -- of colors from red to violet. Note the fainter outer bow caused by double reflections inside the raindrops. Photo by J. B. Kaler
Fig. II-11: Mechanism of Line Absorption and Emission –I (see FK Sec. 5-7, 5-8) Bohr Atom Fig. II-11a e- e- nucleus FK Figure 5-24 Fig. II-11b • = photon e- = electron • E = energy spacing • between electron levels • (See class notes for detailed explanation.) H E Fig. II-11c: Energy Diagram FK Figure 25
Nature of Light: (see FK 5-2, 5-5) Light : both wave (e.m. wave) and particle (photon) with = c / , Eqn(10a) where = frequency and = wavelength of the em wave, c is velocity of light, and h is Planck’s constant., with h = 6.625 x 10⁻³⁴ Js, c = 3.0 x 10⁸ m/s, in cycles/sec = Hertz (Hz) . Planck’s Law: E = h = h c / , Eqn(10b) where E is photon energy, h is Planck’s constant. Line Spectra - Summary: (see FK 5-6 to 5-8) Absorption line, produced when photon is absorbed by electron in a cool gas in a lower energy level and it goes to a higher level., i.e., when an electron is excited, with E =E = h = h c / ,Eqn(10c) where E = energy interval between two bound states of electron. Emission line, emitted when electron in a hot gas in a higher level loses energy and goes to a low`er level, with Eqn(10c).
Ionization: when a bound electron absorbs photon energy and escapes from the atom Atom is ionized and becomes an ion! It happens when E = h = h c / > , Eqn(10d) Excitation: when a bound electron absorbs photon energy and jumps from a lower to higher (both bound) energy level, with Eqn(10c). Ionization energy: . {e.g., H atom = 13.6 ev}. Excitation energy: E. {e.g., H atom E [n=1 (ground state) to n = 2(1st excited state)] = 10.2 ev}. Units (mks): Energy = E = Joule (J) Flux = F = L / area = energy / area-sec = W/s = J/m2s ev = electron volt for energy E: 1ev = 1.602 x 10⁻¹⁹ J Note: keV used for X-rays (1 keV = 103 ev) MeV used for -rays (1 MeV = 10 6 ev)
Spectral Analysis (See FK 5-6) Fig. II-12a: Mechanism of Line Absorption and Emission - II ( see FK Fig. 5 -17) Fig. II-12b: Dark hydrogen absorption lines – in continuous visual spectrum Balmer series Fig. II-12c: Spectrograph
Each chemical element produces its own unique set of spectral lines Fig. II-15: The Sun’s continuum and absorption line spectrum
II-3b. Color and Temperature(Main Ref.: Lecture notes; FK Sec.17-4) • Color: A star’s color depends on its surface temperature See class notes for explanation. FK Fig. II-16: Color (= FK Fig. 17-7)
Photometry and Color Ratios Color Ratio: Measure brightness b, take brightness ratio bB / bU; bV / bB gives color • Photometry measures the apparent brightness of a • star • The color ratios of a star • are the ratios of brightness values obtained through different standard filters, • such as the U, B, and V filters • These ratios are a measure of the star’s surface temperature and color Fig. II-17 UV Photometry Fig. II-18:temperature vs color ratio Fig. II-17:U, B,and V Filters
U for UV (ultraviolet); B for Blue, V for Visual (near yellow). Study Fig. II-18 and Table II-2 (= FK Table 17-1) for temperature and color ratio of different stars. Fig. II-18: Temperature, Color, and Color Ratio (= FK Fig. 17-9)
Color Index: CI = B – V (not in FK, see class notes!) (Note: B = mB; V = mv) CI = B – V = mB – mV = 2.5 log ( bV / bB ) Eqn(11a) mU – mB = 2.5 log ( bB / bU ) Eqn(11b) See class notes for derivation. Table II-2: Color and temperature of selected stars See Class
EX 15a:Red, cool star bV / bB > 1; CI = B – V > 0 Note: Lower T, cooler star, e.g., red star positive CI, and color ratio large > 1 Example: Betelgeuse: Red ;T = 3500 K; bV / bB = 5.55 - large!; CI = 1.86 > 0 EX 15b: Blue, hot star bV / bB < 1; CI = B – V < 0 Note: Higher T, hotter star, e.g., blue star negative CI, and color ratio small and < 1. Example: Bellatrix: Blue; T = 21500 K; bV / bB = 0.81< 1; CI = – 0.23 < 1 EX 15c: Yellow-white, medium temperature star bV / bB > but close to 1; CI = B – V close to 0. Note: Medium T star, e.g., yellow star small CI, and color ratio close to 1. Example: Sun: Yellow-white star; T = 5800 K; bV / bB = 1.87 > 1 but close to 1, CI =0.68, positive but small. See class notes for the details.
How to find `Peak Wavelength’ m? By Wien’s Law: (see FK 5-4) m = 0.0029 / T (K), (in meter) Eqn(12) m = `peak ’ where maximum intensity I comes – shorter for higher temperature T (see Fig. II-19, 20 and Fig. II-9, Lec 3, p.1) I = intensity (= brightness) Fig. II-19: Spectrum METHOD: Measure b in B and V, find color ratio (or color index CI) gives color; e.g., Table II-2 gives Temperature! T I m
Wien’s law and the Stefan-Boltzmann law are useful tools for analyzing glowing objects like stars • A blackbody is a hypothetical object that is a perfect absorber of electromagnetic radiation at all wavelengths • Stars closely approximate the behavior of blackbodies, as do other hot, dense objects • The intensities of radiation emitted at various wavelengths by a blackbody at a given temperature are shown by a blackbody curve Fig. II-20: Blackbody Spectrum
EX 16:Star A: Wavelength peaks at 700 nm. What is the temperature? Ans: T = 4143 K (see class notes.) EX 17:Betelgeuse, Red star from EX 15a. What is the peak wavelengh? Ans: m = 828 nm (see class notes.) ************************************************************************ Note: 1 nm = 10–9 m.
II-3c. Stellar Spectra(Main Ref.: Lecture notes; FK Ch. 5, Sec.17-5) • Spectral Class: O B A F G K M Blue Red • Further classification: 0 to 9 subclasses in each class. e.g., F0, F1, F2, ………….F9, etc. e.g., Sun is G2 star. • IDEA: Classify stars by spectrum /color/temperature. As the class proceeds from O… through… A, F, G,…to K, M, temperature goes from high to low, color changes from blue to red, and prominent spectral lines change.
Prominent spectral lines of different classes (types): Fig. II-22: Line strength vs temperature/spectral class (=FK Fig. 17-12) See class notes for detailed explanation. *********************************************************** The spectral class and type of a star are directly related to its surface temperature: O stars are the hottest and M stars are the coolest
WHY? Needs Atomic Physics, See Fig. II-11, p.3 and Fig. II-12, p.6 of Lec. 3, and class notes for detailed explanation. Note: In order to produce line by excitation, E = E (= h = h c / ) ~ k T Eqn(13) where E (= h = h c / ) = photon energy Summary: • He lines strongest at high T, very hot star, because electrons in He most tightly bound and hence binding energy is large, meaning E is very large (see Eqn(13)). • H lines strongest in the next hot stars because electrons in H is tightly bound next to He. • H lines weak in hottest stars because T is so high in the hottest stars that kT ~ h > , which means electrons gain enough energy from photon to escape the atom – ionization, i.e., E (= h) > , so no lines! • Metal lines (e.g., Fe, Ca) appear in moderate T stars because E of metals is smaller (electrons more loosely bound).
Lines of ions (= ionized element – meaning some electrons missing) (e.g., He II, Ca II, Fe II) found in hotter stars than lines from atoms (= neutral = not ionized) of the same element (e.g., He I, Ca I, Fe I) because electrons in ions of the same element more tightly bound, since they have less electrons, and hence have larger E. • Molecular lines (e.g. TiO) strongest in cool stars because E is smallest for their (molecular rotation and vibration) energy levels. • Note: He I means all of 2 electrons are bound, meaning He atom; He II means singly ionized He, meaning one of 2 electrons is missing; similarly for Ca I (i.e., Ca atom), Ca II (= Ca ion with 1 electron missing), etc. • Study class notes for further details. • See FK for spectral classes of brown dwarfs, L and T – not covered in class.
Table II-3: Properties of spectral class • Unlike true stars, brown dwarfs are too small to sustain thermonuclear fusion • Most brown dwarfs are in even cooler spectral classes called L and T
Fig. II-23 • The number of protons in an atom’s nucleus is the atomic number for that particular element • The same element may have different numbers of neutrons in its nucleus. These slightly different kinds of elements are called isotopes
class G2 Spectra of different classes of main sequence stars He lines H Fig. II-24: The spectra of real stars