
Drainage
E N D
Presentation Transcript
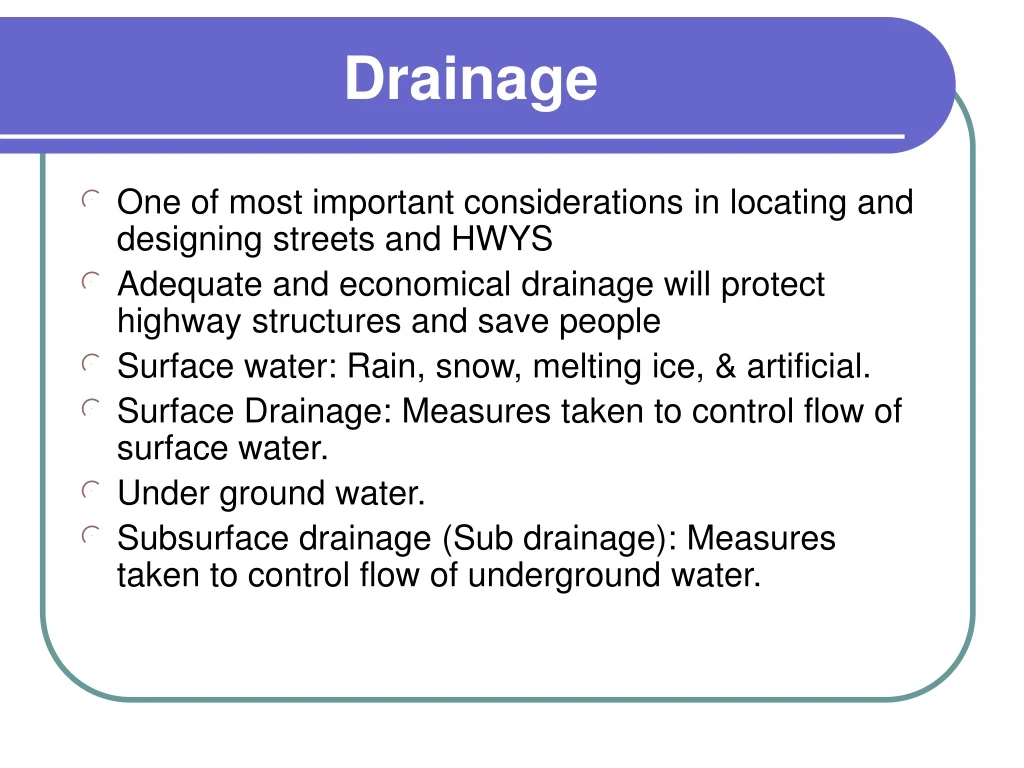
Drainage • One of most important considerations in locating and designing streets and HWYS • Adequate and economical drainage will protect highway structures and save people • Surface water: Rain, snow, melting ice, & artificial. • Surface Drainage: Measures taken to control flow of surface water. • Under ground water. • Subsurface drainage (Sub drainage): Measures taken to control flow of underground water.
Surface Drainage/ Rural • Rural: 1. Roadway crown 2. Shoulder & Side slope (Table 12.1 Ranges for cross slopes for pavements & Shoulders) - Steep to drain but safe and comfortable for driver. 3. Ditches (Open Channels) • Mostly In cut sections, • Flat bottomed or Vee • Grades similar to CL. • (Table 8.2-3 for recommended cross sections) 4- Culverts, Bridges • Cross-Drainage . • Rural (Divided): • + Previous • Inlets and storm drains (Underground pipes in median).
Surface Drainage/ Urban (City Streets) • Pavement crowns • Curbs, and gutters (function as side ditches) • Inlets • At intersections to intercept water flowing in gutters before it reached sidewalks. (See Figure 12-19) • Catch basin • Similar to inlet but trap debris before entering storm sewer. • Manholes • Facilities used to clean clogging storm sewer systems. • Placed @ (Grade change, junctions, intermediate points 90 -150 m) • 1.2m D, Concrete blocks, masonry, bricks • Cast iron circular cover 60 cm.
Prevention of Erosion • Soil adjacent to roadways can be subjected to erosion by surface water. • Erosion results in : • Destruction of productive soil • Clogging of ditches & drainage structures • Endangering stability of side slopes. • Measures to reduce Erosion: • Turf culture (growing grass on slopes). • Intercepting ditches • Riprap, or hand placed rocks in steep slope where erosion is sever.
Sub Drainage • Control of groundwater encountered in highway locations. • Purpose: control seepage, lowering ground water table, base and shallow subgrade drains. • Circular pipes laid at suitable depth in a trench, which is then backfilled with porous granular material. • Pipes materials: Porous concrete, perforated metal, or vitrified clay • 6 – 8 inches reach up to 24inches. • Slope: steep enough to prevent deposition or setting of materials entering the pipe through joints or perforations. • Intercepting drains, lowering water table, and base drainage.
Design of Surface Drainage • Major Phases • Estimate quantity of water that is expected to reach the system. • The hydraulic design of each element in the system. • The comparison of alternative system to select most economical system.
Hydraulic Approach & Concept • Estimate of Run Off • Existing stream…..use available records. • Return Period (RP): Estimated frequency for rare events (floods) (i.e. peak design flow). • Higher R P = More sever storm = More costly system. • R P = 50yrs for interstate, = 10 – 25 yrs for streets and roads, and 5 – 10 yrs for light traffic facilities.
Hydraulic Approach & Concept Cont. • Flood frequency • Statistical based • Indicate mean annual flood as a function of the size of the drainage area for each hydrological region. • Regional flood curves are available (Flood Hydrographs (flow vs. time) see Fig. 12-1. • Engineers design drainage facilities to accommodate the peak flow.
Hydraulic Approach & Concept Cont. • Rain fall intensity is function of • Duration of rainfall. • Occurrence (return period). See Figure 12-2 Note: Small durations provide higher rainfall intensity. • Duration of rainfall is chosen based on the time of concentration
Hydraulic Approach & Concept Cont. • Time of concentration: It is the duration of rainfall required to produce the max. rate of run off. • Time of concentration = Time of flow (over land + in drainage system) • Time of over land flow: time for a water particle to travel from most remote point in drainage area to point where it enters the drainage system. • Time of over land flow = F (Slope, type of surface, length,…) • Estimates of flow in drainage system can be made from observed or computed velocities of flow.
Surface Run Off • Rains fall on pervious surfaces : Pass into soil, disappear (evaporation and/or run off) • Water lost by evaporation is negligible. • Drainage must be provided for all water not infiltrating into the soil or not stored temporarily in surface depressions. • Infiltration rate of water = F (Type and gradation of soil, soil covers, moisture content, temperature of water, air, and soil, impervious layer presence or absence). • Frozen soil is impervious. • Rate of infiltration is assumed to be constant during design storm
Surface Run Off Cont. • Rate of Run off = F (Land nature, degree of saturation, Slope of surface). • Small where vegetations present. • Large for smooth surfaces. • Table 12-2 Run off Coefficients values. • If drainage area is composed of several types of surfaces, the run off coefficient to be used is the weighted average.
Rational method • Most Common • Used for small areas (200 acres) • Q = C I A • Q = Run off (Ft3/sec) • C = Run off Coeff. (ratio (run off/ rain fall) • I = Rain Fall Intensity (in./ hr) for the estimated time of concentration. • A= Drainage Area (acres). • 1 acre = 4046.87 m2
Rational method • Most Common • Used for small areas (80 hectares) • Q = C I A / 360 • Q = Run off (m3/sec) • C = Run off Coeff. (ratio (run off/ rain fall) • I = Rain Fall Intensity (mm/ hr) for the estimated time of concentration. • A= Drainage Area (hectares) • 1 hectare = 10,000 m2
Manning’s Formula V = [R2/3 * S1/2]/ n V = Mean Velocity (m/s). R = Hydraulic radius (m) =[Area / wetted perimeter]. S = Slope of channel. n = Manning’s roughness coefficient. Q = A V
Run Off for Large Rural Drainage Basins • Software, National Flood Frequency Program (NFF), available from U.S. Geological Survey (USGS). • It provides a mean for computing the peak discharge for any place in US. QT = a Ab Sc Pd QT= Rural Flood Peak discharge for a reoccurrence interval T. A = Drainage Area S= Channel Slope P = Mean annual precipitation A, b, c, d = regression coefficients (See Table 12-3)
Run Off from Urbanized Areas • In urban areas growth & development may contribute to flooding & unexpected failures of highway drainage facilities. • Removal of vegetation & replacement by impervious pavements & buildings. • Improvement of natural watercourses by channelization. • Enhancement of the natural drainage system by storm sewer & open channels. • These improvements decrease infiltration rate& travel time and increase peak discharge. • The NFF program provides equations for estimating flood run offs from urbanized areas. • See Table 12-4.
Energy of Flow in Open Channels • Flowing water energy • Potential (Depth of water + Elev. Of channel bottom above datum plane). • Kinetic (velocity head v2/2 g). Specific head = (d + V2/2g) • Lowest specific head = flow with min. energy. The depth at this point is the critical depth (dc), and the velocity is the critical velocity (Vc).
Energy Flow • Sub-Critical Flow • Large depth & Low velocity. • dn > dc & Vn < Vc. • Flow is Tranquil. • Observed in broad valleys and plains. • Slope flatter than critical slope. • Super Critical Flow • Shallow depths and high velocities. • dn < dc & Vn > Vc. • Slope steeper than critical. • Observed in mountainous areas.
Design Procedure • Select Channel cross section that will carry the discharge on the available slope. • Figure 12-3 gives direct solution of Manning Equation (Trapezoidal with 2:1 side slopes and fixed bottom width). • Find (Qn) project vertical line up to intersect with slope….. Read depth. • From intersection project horizontal line and read (Vn)….. Find V. • Compare V and D with critical V &D to decide type of flow. • Vc & Dc are independent of value of n. • (See Examples 12-1 & 12-2)
Prevention of Erosion in Channels • Erosion Cause: • Unsightly & hazardous ditches. • Pollution of near by lakes & streams. • Increase maintenance cost because of sedimentation. • Prevented by: • Provide protective lining along bottom & sides.
Lining Types • Rigid: • Portland cement concrete, soil cement. • More expensive. • Smoother… could cause high velocities. • Used in sever service conditions. • Flexible • Riprap & vegetations. • Inexpensive & easy to maintain. • Aesthetically pleasing. • Unsuitable for sever service conditions. • Used with gradients up to 10%.
Lining Design • Type of lining based on: • Before: Max. allowable velocities. • Recently: Max. permissible shear stress • Computed/ Permissible • Computed shear = F (flow depth, channel slope) • Max shear is at edges • Design flow rate (5 – 10) yrs • Assume shape for design
Culverts • Its top doesn’t form part of the traveled way as bridges. • Span length =< 20ft • Designed to flow full under certain conditions. • Bridges designed to pass floating debris or vessels.
Culverts Location & Shape • Important to select culvert location (Station no.), alignment, and grade • Location: • Bottom of depression where no natural water course exist. • Where natural stream intersect the roadway. • Alignment: • Conform with natural stream • Cross roadway at right angles (economy) • Skew culverts are needed sometimes • Grade: • Conform to existing grade of stream • Reduced grades through culverts…..velocity reduction…..sediments deposition….reduce capacity • Increasing culvert grade…..velocity increase…..erosion at outlet and beyond.
Culverts Shape & Materials • Shapes (See Figure 12-6): • Circular • Box (rectangular) • Elliptical • Pipe Arch • Arch • Metal Box • Materials: • Concrete • Corrugated metal (Steel) • Inlet Types (See Figure 12-7): • Projecting barrel. • Cast in place concrete headwall & wingwalls. • Precast end section. • End mitered to the slope.
Hydraulic Design of Culverts • Purpose: To provide a drainage facility or system that will adequately and economically drain the estimated flow throughout the design life without unreasonable risks to the roadway structure or nearby property.
Culvert Design Procedure • Obtain all site data & plot a roadway cross section at the culvert site, including a profile of the stream channel. • Establish the culvert elevations, inlets and outlets, and determine culvert length and slope. • Select a type and size of culvert. • Examine the need for energy dissipaters.
Culvert Design • The allowable level of headwater upstream of the culvert entrance is generally the principal control of the culvert size and inlet geometry • The allowable headwater depth depend on the topography and nature of land use.
Types of Culverts Flow • Type of flow depends on the total energy available between inlet and outlet. • Available energy consist of the Potential energy or the difference in head water and tail water elevation. • Energy expended at the entrance in friction, velocity head, and in depth. • Flow characteristics & capacity are determined by location of control section. • Control section: Section of the culvert that operate at max flow. • Types of control: Inlet control & outlet control. • Figures 12-8 & 12-9
Culverts with inlet control • Discharge capacity depends on the depth of Head Water (HW) at the entrance, the entrance geometry, and type of inlet edge. • Occurs when slope of the culvert is steep and outlet is not submerged. • Series of nomographs (Fig. 12-10,11)
Culverts with Outlet Control • Max flow depends on the depth of HW and geometry of entrance in addition to the elevation of tail water at the outlet, slope, roughness, and length of culvert. • Occurs in flat slopes especially when down streams conditions cause tail water depth to be greater than the critical depth.
Culvert Design • See example 12-3. • Inlet control : Find HW & control HW Elev. • Outlet: TW, dc, ho = TW or [(D+dc)/2] which is greater, ke, Find H= energy loss • HW Elevation at outlet = ELo + ho + H • Compare control HW Elev. For inlet and out let Elev. The higher controls the flow.
Improved Culvert Inlet Design & Type Selection • Bevel-Edge Inlet • Side-Tapered Inlet • Slope-Tapered Inlets. • See Fig. 12-15 • Selection of Culvert Type: Depends on • Hydraulic requirements • Strength (support fill & traffic loads) • Economics