Bioelectric Impedance Analysis
Discover the clinical relevance of BIA for evaluating metabolic status, body composition, and cellular health. Understand BIA indicators and their implications for overall health. Learn about Lance Armstrong's BIA monitoring and the impact on health outcomes.

Bioelectric Impedance Analysis
E N D
Presentation Transcript
Bioelectric Impedance Analysis The Breakdown Of How It Works And Why You Need It Dr. June Riedlinger, R.Ph., Pharm.D., ND Certified First Line Therapy Provider
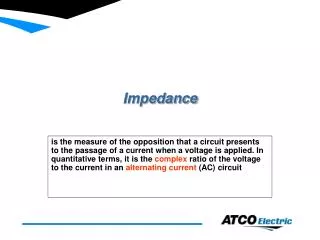
Clinical Relevance of BIA “BIA is an important clinical tool for evaluating the metabolic status of patients. It is inexpensive and noninvasive, and it provides useful information concerning altered body composition and membrane potential at the tissue level measured by phase angle.” Jeff Bland PhD.
Clinical Relevance of BIA “BIA is a simple in-office test that converts easily obtained electrical measurements into information about the patient’s body composition and fluid distribution ...” Robert Rakowski DC
Biomarkers 2000 • Portable • Battery powered • Highly accurate meter • Mini-computer • Inkless printer (thermal paper)
Pre-test Preparation • No alcohol within 24 hours • No exercise for 4 hours • Avoid caffeine or food for 4 hours • Consume 2-4 glasses of water within 2 hours
Bioelectric Impedance Analysis (BIA) “Bioelectric impedance analysis is a simple, noninvasive, rapid, portable, reproducible, and convenient method of measuring body composition; it is sufficiently accurate for clinical use and makes fewer physical demands (than anthropometric techniques).” JADA 2001;101(10):1209-1212
Phase Angle, Capacitance, • Resistance and Reactance • Do not rely on input of patient’s • height, weight, age or sex.
Mass Distribution Results are • based on findings from large • population studies. • These numbers require • accurate input of a patients • height, weight, sex and age.
Increasing lean body mass will reduce resistance which is a positive change.
When your lean body mass increases You will increase reactance which is positive change.
STEP 1 • Total Body Water/Fat Free Mass = TBW/FFM • This marker refers to the hydration of the patient. • Must be higher than 69% for a test to be valid. • If <69%, patient should be put on hydration protocol and retested in 24-48 hours. • Higher is typically better • Accurate even when subject is significantly overweight
STEP 1 (CONTINUED) • TBW/Total Weight • Percentage of total weight that is water • Declines with age • Shows dehydration if person is significantly overweight.
STEP 2 • Phase angle • General indicator of cellular health • Provides info on cell membrane potential at the tissue level
Cellular health tends to be correlated to a person’s phase angle Lance Armstrong Suboptimal
STEP 3 • Intracellular Water • Healthy cells maintain their integrity and hold their fluid inside • >60% is optimal. • Changes with age • Extracellular Water • Water volume outside of the body cell mass • Higher values may be related to fluid retention
STEP 4 • Fat Free Mass vs. Fat • Determine the amount of metabolically active tissue in the person. • Optimal range depends on sex and age of person. • BIA can determine both subcutaneous fat (Love Handles) as well as visceral fat found around the organs of the body. • Advantage over calipers to assess true health status.
Do You Believe in Miracles? • Lance Armstrong is monitored with the BIA during his preparation for the Tour • de France.
“. . . we found that fat-free mass was lower and fat mass was higher in acutely ill and chronically ill patients than controls.” J Amer Diet Assoc 2002;102(7):944-955
STEP 5 • ECM/BCM • Ratio of extracellular mass (non-metabolically active) to body cell mass (metabolically active) • Low value is desirable • Upward shift suggests imbalanced weight loss. • Downward shift suggests balanced weight loss. • Use Body Composition Protocol to shift.
“Sarcopenia is the backdrop against which the drama of disease is played out: a body already depleted of protein because of aging is less able to with stand the protein catabolism that comes with acute illness or inadequate protein intake.” JAMA 286(10) (2001)
BIA may be clinically useful for demonstrating sarcopenic obesity in women at normal body mass indices, with additional studies necessary to determine the metabolic reasons underlying this change in body composition. Am J Clin Nutrition 1996; 64:472S-477S
STEP 6 • Body Mass Index • BMI correlates with a person’s health. • Studies show even moderate BMI shifts mean health consequences. • Lower is better • Alter using Body Composition Program.
Weight Gain and Diabetes Risk Weight Change Since Age 21 Relative Risk Body Mass Index at Age 21 Adapted from Chan JM, et al. Diabetes Care 1994;17:960-969.
26 -Year Incidence of Coronary Heart Disease in Men Incidence/1,000 BMI Levels Adapted from Hubert HB, et al. Circulation 1983;67:968-977. Metropolitan Relative Weight of 110 is a BMI of approximately 25.
Bray GA. Overweight is risking fate. Definition, classification, prevalence and risks. Ann NY Acad Sci 1987;499:14-28. Relationship of BMI to Excess Mortality 300 Age at Issue 20-29 250 30-39 200 150 Mortality Ratio 100 High Moderate Low Risk Risk Risk 50 0 15 20 25 30 35 40 Body Mass Index (kg/[m2])
STEP 7 • Basal Metabolic Rate • BMR- is the amount of calories a person burns during a 24 hour period while at rest. • More lean body mass will increase the BMR • Higher is typically better. • Each person is very unique • Essential in establishing a proper body composition program.
Dr. June Riedlinger R.Ph., Pharm.D., ND FLT Certified Provider FLT is based on National Institutes of Health TLC program recommendations. Allows for me to tailor to your needs. Delivers a concise and effective report of findings.