Download
1 / 4
40 likes | 163 Vues
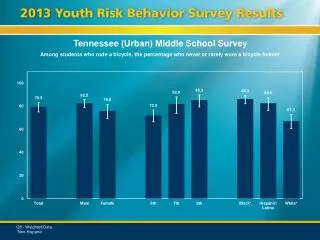
This summary presents weighted results from the Tennessee High School Survey, highlighting the percentage of students expressing various opinions and the number of students in a class of 30. The graphs illustrate key statistical findings, ensuring a clear understanding of student demographics and perceptions. Detailed summaries provide additional context and insights into the data collected. For a more nuanced analysis, refer to the corresponding tables that explain the underlying methodology and results in depth.

E N D
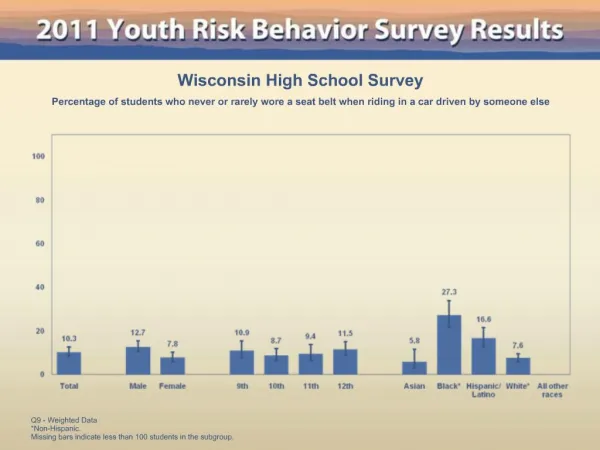
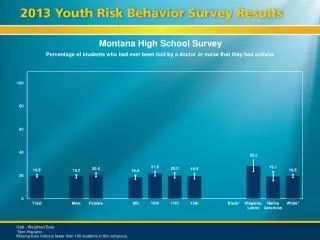
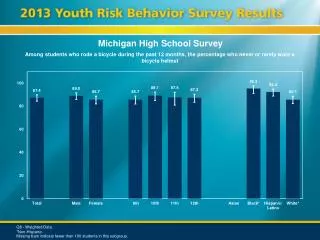
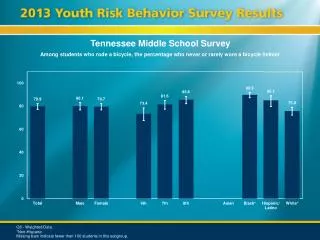
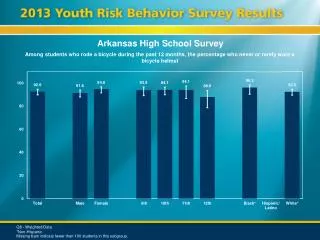
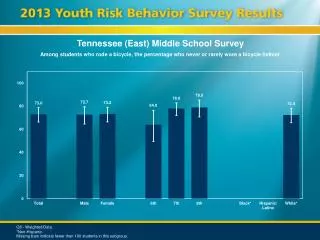
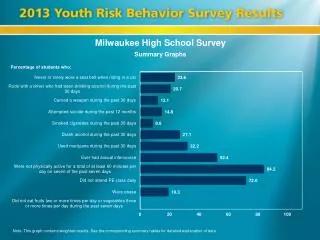
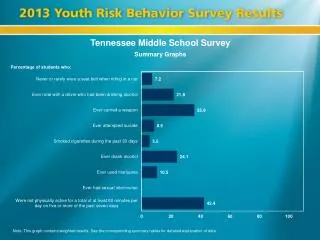
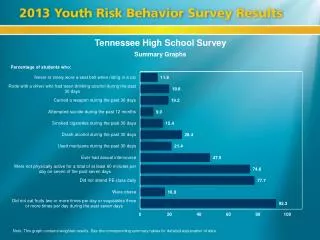
Tennessee High School Survey Summary Graphs Percentage of students who: Note: This graph contains weighted results. See the corresponding summary tables for detailed explanation of data..
Tennessee High School Survey Summary Graphs Percentage of students who: Note: This graph contains weighted results. See the corresponding summary tables for detailed explanation of data..
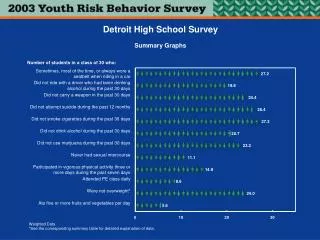
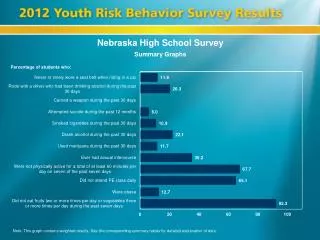
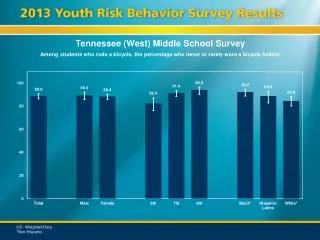
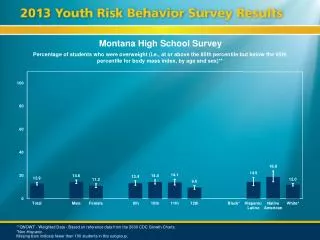
Tennessee High School Survey Summary Graphs Number of students in a class of 30 who: Note: This graph contains weighted results. See the corresponding summary tables for detailed explanation of data.
Tennessee High School Survey Summary Graphs Number of students in a class of 30 who: Note: This graph contains weighted results. See the corresponding summary tables for detailed explanation of data.