2. TRANSITION
230 likes | 470 Vues
2. TRANSITION. Privatization Macroeconomic stabilization. CHANGES OF THE ECONOMIC SYSTEM. COMPONENTS OF TRANSITION. 2.1. Privatization - objectives - efficiency, justice, democracy - complexities of privatization - privatization models - outcomes of privatization

2. TRANSITION
E N D
Presentation Transcript
2. TRANSITION Privatization Macroeconomic stabilization
COMPONENTS OF TRANSITION • 2.1. Privatization • -objectives - efficiency, justice, democracy • - complexities of privatization • - privatization models • - outcomes of privatization • 2.2. Macroeconomic stabilization • - assumptions and Washington consensus • - transformational depression • 2.3. Microeconomic restructuring • 2.4. Creation of a new economic system • A Case: Slovenia; Could SEE countries follow Slovenian experiences?
DILEMMAS OF PRIVATISATION MECHANISM Distribution Sales to whom to whom to everybody - to employees to citizens - to foreigners - equally - Patterns - by age - stock market - by years of employment - auctions • Patterns - workers-managers by outs • direct - debt equity swaps • indirect - direct sales • Restitution - increase of capital • in kind • compensation
Privatizations in CEE Countries Czech Republic: a rigid socialist system, 96.7% of production in state industries, Vaclav Klaus, shock therapy to market without adjectives, restitution (100.000 units), small privatization - sales (12300 units), large privatization – public auctions, public tender, direct sales, sales of shares for vauchers, employees stock ownership plans; vauchers collected by private investment funds, direct sales of companies Avia Praha, Skoda auto, Tabak Kutna Hora, banks, telecomunications etc. To foreign owners Estonia: small scale privatization in 1990, large scale Privatization Act of 1992- direct sales to foreign investors, vauchers in 1994 marginal, Eesti Telekom, Estonian Air (Denmark), Estonian Shipping Company (American/Norwegian), Tallina Vesi (utilities), electricity, banking sector Hungary: “gulash socialism”, centralized privatization for small scale privatization, management by-outs, former owners, new phase in 1995 by selling companies to multinationals, golden share in some companies PRIVATIZATION BAROMETER
SHARES OF FOREIGN STOCK IN CEE COUNTRIES Country stock FDI/GDP in % Share of foreign banks 1994 1999 2003 in assets 2001 Czech Republic 11.0 14.148.090.0 Estonia 9.2 19.377.698.9 Latvia 7.6 13.935.165.2 Lithuania 0.7 5.727.278.2 Hungary 17.1 25.351.888.8 Poland 4.1 5.824.968.7 Slovakia 6.1 4.231.585.5 Slovenia 9.2 9.520.720.6
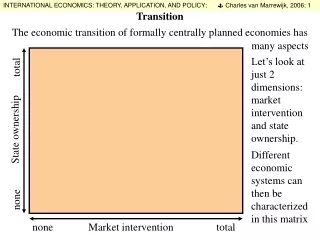
MACROECONOMIC STABILIZATION Assessment of economic situation: D>S, Washington consensus; Increase of Supply: liberalization of imports, pure socialist production goods; Decrease of Demand: price liberalization, restrictive credit policy, restrictive fiscal policy; freeze of wages, fixed exchange rate; Results: economic depression, measured and actual, unemployment, social diferentiation; Slovenian transition model; ignorance of Washington agreement, gradualism, floating exchange rate
ASESSSMENTOF ECONOMIC SITUATION IN SOCIALIST COUNTRIES Aggregate supply and demand curves Supply Prices Demand Equilibrium price Price in socialism Shortage output Supply Demand
TRANSFMATIONAL DEPRESSION CEE CIS
TRANSITION MODELS IN CEE 1.Baltic 2.Visegrad 3. Slovenia Starting position EE, LT, LV CZ,HU, PL, SKSI Privatization sales to sales to free distribution foreigners foreigners MW by-outs Stabilization fixed ex.rate switching floating fiscal discipline adaptable adaptable Social Considerations absent present important Restructuring absent by FDI decentralized Problems CA deficit CA deficit balance emigration budget deficit EMU problems MODEL neoliberal emmbeded neocorporativist neoliberal
ECONOMIC PERFORMANCE IN 2007 (1) (2) (3) (4) (5) (6) (7) (8) EU27 100 2.9 2.3 7.1 -0.9 58.7 -0.6 4.8 BG 38.1 6.3 7.6 6.9 3.4 18.2 -21.5 3.5 CZ 81.3 6.8 3.0 5.3 -1.6 28,7 -3.3 3.5 EE 70.6 10.4 6.7 4.7 2.8 3.4 -17.3 5.5 LT 58.0 11.9 10.1 6.0 0.0 9.7 -22.9 7.9 LV 61.0 7.8 5.8 4.3 -1.2 17.3 -13.7 6.3 HU 63.5 4.1 7.9 7.4 -5.5 66.0 -4.9 5.5 PL 53.8 6.2 2.6 9.6 -2.0 45.2 -3.7 5.6 RO 40.6 8.2 4.9 6.4 -2.5 13.0 -14.1 5.3 SI 90.9 5.9 3.8 4.9 -0.1 24.1 -4.9 3.4 SK 68.6 8.5 1.9 11.1 -2.2 29.4 -5.7 4.0 (1) GDP/capita, (2) GDP growth, (3) inflation, (4) unemployment, (5) budget deficit/GDP, (6) public debt (7) current account, (8) inequality coefficient
EMPLOYMENT FUNCTIONrE=a+b*rQ+c*D Labor market “a” “b” “c” consequences traditonal + 0 0 no labor market, high hidden socialism unemployment selfmanaged 0 0.3 - growing hidden unemployment socialism low open unemployment classical (US) - 1 0 flexible labor market capitalism open unemployment traditional European - 0.5 - low hidden unemployment capitalism high social protection neo-evropean - 0.7 + growth of open unemployment capitalism hysteresis rZ- growth of employment, rQ – growth of GDP, D- dummy, a-autonomous growth, b-elasticity, c- assymetry
EMPLOYMENT MECHANISMS Centraly planned economy Selfmanagement Social market economy OUTPUT Pure capitalism Neo-European capitalism
RESTRUCTURING BY FDISPILL-OVER EFFECTS OF FDI THEORETICALLY POSITIVE (OECD 2003) • FDI transfers technology and know-how; • FDI contributes to enterprise development and restructuring; • FDI contributes to international trade integration; • FDI bolsters competition; • FDI supports human capital formation; IN REALITY . FDIs were acqusitions rather than greenfield investments, thus not investments in the macroeconomic sense; • FDIs concentrated to finance, trade, and communications; • FDIs increased imports more than exports; • FDIs increased specialization within a multinational cutting links with the rest of the economy; • FDI brought strong monopolies forcing small emerging domestic firms out of business; • FDI creates addiction, income account deficit, and gap between GDP and GNP;
RESTRUCTURING BY FDIFDI, CURRENT ACCOUNT, AND INDEBTEDNESS CA/GDP FDI/GDP Net external stock FDI/GDP foreign banks 10 years average position 2004 1994 2003 in assets 2003 Czech R. -4.05 5.80 -34.6 11.0 48.0 90.0 Estonia -7.46 6.03 -99.7 9.2 77.6 98.9 Hungary -4.40 4.31 -96.9 17.1 51.8 88.8 Latvia -5.48 5.96 -55.0 7.6 35.1 65.2 Lithuania -8.36 3.42 -38.9 0.7 27.2 78.2 Poland -2.64 2.73 -53.3 4.1 24.9 68.7 Slovakia -6.37 3.44 -37.5 6.1 31.5 85.5 Slovenia -0.51 1.04 -18.0 9.2 20.7 20.6 Average -4.91 4.10 -56.7 9.3 39.6 74.5