Download
1 / 17
170 likes | 347 Vues
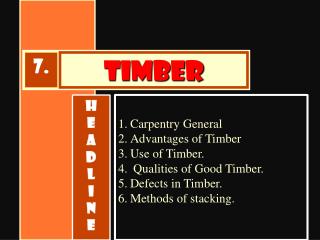
Timber vs. Row Crops. William L. Hoover. Under what circumstance can conversion of forestland to crop land be justified financially?. Proxy for net-income from row crop farming. Average Value of Farm Real Estate. Comparing Crops and Timber. Use equivalent annual income to landowner

E N D
Timber vs. Row Crops William L. Hoover Under what circumstance can conversion of forestland to crop land be justified financially?
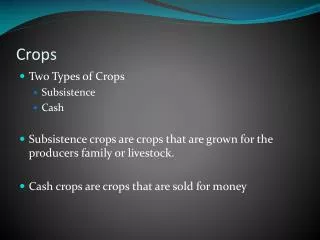
Comparing Crops and Timber • Use equivalent annual income to landowner • Tax treatment • Land rent – ordinary income • Timber income – capital gains income • Cost of timber growing stock – not considered • Conversion costs – considered in terms of how much can afford to pay • Land clearing • Drainage • Soil modification
Basis of Timber Values • Purdue Forest Products Price Report and Trend Analysis • Weighted average price series • Quality stand • Average stand • Growth • Quality stand – 350 board feet per acre per year (bf/A/year) • Average stand – 150 bf/A/year
Weighted Average Price for Quality Stand Nominal Deflated Trend line is equivalent to 1.5% per annum W. Hoover. Annual. Indiana Forest Products Price Survey and Trend Analysis, Purdue Univ. Coop. Ext. Svc.
Cash Rent Compared to Net Value of Timber Growth, Nominal Net Value of Timber Growth Cash Rent Cash Rent – PU AGEC Annual Survey Timber Growth - .35 MBF per Acre per Year Timber Value – PU FNR Weighted Average Price for Quality Stand, 1982 $’s Timber Annual Cost - $4 per Acre, 1982 Base Year, Adjusted for Inflation
Cash Rent Compared to Net Value of Timber Growth, Deflated Net Value of Timber Growth Net Value of Timber Growth Net Value of Timber Growth Cash Rent Cash Rent Cash Rent Both series adjusted for inflation by PPI for Finished Goods
Premium of Managed Timber Over Crops, Deflated Net Value of Timber Growth minus Cash Rent
Weighted Average Price for Average Stand Nominal Deflated Trend line is equivalent to 1.1% per annum W. Hoover. Annual. Indiana Forest Products Price Survey and Trend Analysis, Purdue Univ. Coop. Ext. Svc.
Premium of Crops Over Unmanaged Timber, Deflated Cash Rent minus Net Value of Timber Growth Timber Growth – 0.15 MBF per Acre per Year Timber Value – PU FNR Weighted Average Price for Average Stand Timber Annual Cost - $1 per acre in 1982 adjusted for inflation
Case 1, Existing Stand of Productive Timber • Well stock stand of central hardwood timber • Harvest every 10 years • Harvest revenue annualized at 3% APR • Cash rents range from $80 to $120 per acre • Calculate timber revenue that it takes to breakeven with cash rent • Land clearing costs on considered
Case 2, CRP Land With Trees • Timber plantation 15 years old • First harvest in 50 years • Harvest revenue annualized at 3% APR • Cash rents range from $80 to $120 per acre • Calculate timber revenue that it takes to breakeven with cash rent • Land clearing costs on considered
Breakeven Level of Timber IncomeExisting Stands / CRP with Trees
Breakeven Level of Timber GrowthExisting Stands / CRP with Trees
Average Annual Net Growth • Indiana – 127 bf/A/year (Doyle) • 533,016 MBF • 4.34 million acres • Ohio – 123 bf/A/year (Intl.) • 965,540 MBF (Intl.) • 7 million acres • Ohio – 80 bf/A/year (Doyle)
Conclusions • Doesn’t pay to clear highly productive well managed forestland • May pay to clear low productivity poorly managed forestland • Clearing of CRP land with trees will usually pay