Download
1 / 29
300 likes | 495 Vues
Call Center Performance Measuring & Improving. North America’s Leading Experts for Measuring and Improving Call Center Service Quality Performance. Mission Statement….

E N D
Call Center Performance Measuring & Improving North America’s Leading Experts for Measuring and Improving Call Center Service Quality Performance
Mission Statement… To be operationally excellent at being a quality assurance solutions provider that helps call centers measure and improve their service quality, sales and first call resolution performance. North America’s Leading Experts for Measuring and Improving Call Center Service Quality Performance
Facts About SQM Group… • We benchmark over 200 leading North American call centers on an annual basis and we have been conducting this benchmarking study for over 9 years • On an annual basis we conduct over 250,000 surveys with customers who have used a contact center’s call center, email, website or IVR channel services • We also conduct over 20,000 surveys yearly with employees • Our experience in call center service quality measuring, benchmarking, tracking and managing are unsurpassed and enable us to provide call centers with unique insights into developing and implementing world class customer service • The majority of SQM’s tracking clients improve on customer satisfaction and operating cost North America’s Leading Experts for Measuring and Improving Call Center Service Quality Performance
SQM Clients… Some of the most successful organizations in North America utilize SQM Group’s expertise to benchmark and track their call centers customer and employee satisfaction such as: • Telcos/Cable… Rogers, Bell, FIDO, TELUS, Sprint, SaskTel, Star Choice, AT&T, etc • Banks… Royal, CIBC, Scotiabank, Bank of Montreal, TD Bank, Wells Fargo, US Bank, ING, Citifinancial, etc • Retail/Hospitality… Canadian Tire, Sears, Marriott Hotel, WestJet, Staples, Officemax, Safeway, Molson, etc • Government… Treasury Board, Citizen & Immigration, HRDC, Provincial and Local Government • 81 of the 100 largest call centers in Canada are SQM clients • The average SQM call center client size is 400 work stations handling 3.6 million inbound calls • SQM enjoys 95% customer retention North America’s Leading Experts for Measuring and Improving Call Center Service Quality Performance
Call Center Industry Comparison Overall Customer Satisfaction By Industry…
Call Center Historical Overall Employee Satisfaction By Industry…
Call Center Key Performance Indicators Average Calls to Resolve Inquiry is 1.2 Average Calls to Resolve Inquiry is 1.5 Average Calls to Resolve Inquiry is 2.0
Contact Channels Comparison Key Performance Indicators… Note: Website ratings are for only the banking industry Website Average Contacts to Resolve Inquiry is 1.2 IVR Average Calls to Resolve Inquiry is 1.3 Call Center Average Calls to Resolve Inquiry is 1.5 Email Average Calls to Resolve Inquiry is 1.7
Contact Channels Comparison Overall Impression of Company has Changed as a Result of Contact Method Experience… Top Box Better Rating Note: Website ratings are for only the banking industry
Employee and Customer Relationship Study Conducted for Treasury Board of Canada North America’s Leading Experts for Measuring and Improving Call Center Service Quality Performance
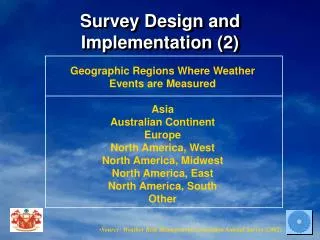
Study Methodology… • The study is based on data collected from January 1, 2004 to March 31, 2005 • Customer data is based on 208,125 surveys of customers who phoned a call center in North America • Employee data is based on 18,652 surveys of employees who work in a call center in North America • 212 call centers in North America have participated in SQM’s benchmarking study (14% are in the public sector; 86% are in the private sector) • Call center sample size breakdown percentage is as follows: • Low performing call centers are 21% • Average performing call centers are 63% • High performing call centers are 16% • Call center performance criteria is as follows: • Low performing call centers are based on customer satisfaction that is 54% and below • Average performing call centers are based on customer satisfaction that is 55% to 69% • High performing call centers are based on customer satisfaction that is 70% and above
Call Center Customer & Employee Overall Satisfaction Improvement Comparison Customer Question… Based on your last call to their call center, overall how satisfied are you with the call center? Key Finding… High performing call center overall employee satisfaction improvement % is approximately the same as overall high performing call center customer satisfaction improvement %. Therefore, SQM is of the strong opinion that employee satisfaction impacts customer satisfaction for both the public and private sectors. Employee Question… Based on your working experience at the call center, overall how satisfied are you working at the call center? Note: Rating % is top box very satisfied rating
Employee & Customer Satisfaction Relationship Map… Key Finding: Overall private or public call center’s employee and customer relationship is positively or negatively correlated. No Relationship Correlation Positive Relationship Correlation Higher 45% • PrivateHigh • AllHigh • PublicHigh • PrivateAverage 35% Employee Satisfaction • AllAverage • PublicAverage • PrivateLow • AllLow • PublicLow Lower 20% Negative Relationship Correlation No Relationship Correlation 45% Lower Higher 90% 65% Customer Satisfaction
Employee and Customer Attribute Linkage… Public Key Finding… High performing call center employee satisfaction attribute improvement % is approximately the same as high performing call center customer satisfaction attribute improvement %. Legend: HC=High Call Center AC=Average Call Center LC=Low Call Center Note: Points are based on very satisfied ratings
Call Center Source of Error for Not Achieving First Call Resolution Comparison
Call Center Key Performance Indicators Comparison Public Key Finding… High performing call centers employee satisfaction increases customer satisfaction resulting in a better (lower) Avg. calls to resolve. Note: Rating % is top box very satisfied rating
Call Center Avg. Calls to Resolve Gap Comparison Key Finding… High performing call centers Avg. Call to Resolve is substantially better (lower) than average and low performing call centers resulting in lower operating costs.
Business Case Why to Improve Employee Satisfaction … Employee Satisfaction Impact Customer Satisfaction Impact First Call Resolution Impact 1% improvement in Employee Satisfaction Equals 2% improvement in Customer Satisfaction 1% improvement in Customer Satisfaction Equals 1% improvement in First Call Resolution (FCR) 5% improvement in FCR Equals .1 improvement in Avg. Call to Resolve Key Finding… Based on a 2.5% improvement in Employee Satisfaction, an average call center can improve Avg. Call to Resolve by .1 and can potentially save $1.7 Million Avg. Call to Resolve Impact
Top 10 First Call Resolution Practices North America’s Leading Experts for Measuring and Improving Call Center Service Quality Performance
Top 10 First Call Resolution Practices… Management • In Your Heart & Mind • Senior Management Involvement • Senior Management Line of Sight • Stable Management Team at all Levels
Top 10 First Call Resolution Practices… Awareness • Business Case Shared • No Job Loses • Weekly Meetings Sharing Results
Top 10 First Call Resolution Practices… Goals & Accountability • At all Levels • Call Types, Segments & Locations • Key Vendors • FCR & Average Calls Needed for Call Resolution
Top 10 First Call Resolution Practices… Resolution Outcome • Focus on Outcome versus Journey • Take Ownership • Apologies & Recovers • Best Available Solution • Customer Acceptance of Resolution • Recognizing Customer Dissatisfaction
Top 10 First Call Resolution Practices… 2 Plus Calls • Reason for 2 Plus Calls • Source of Errors • Customer Feedback
Top 10 First Call Resolution Practices… Measurement • Measure Weekly • Measure FCR, Average Calls Needed for Resolution & Service Quality Attributes • Customer is the Judge • FCR/CSR Integrity • For the QA program separate business and customer measures • Call Monitoring/FCR Calibration
Top 10 First Call Resolution Practices… Coaching • Upfront CSR Training • Train the Supervisors • Benchmark Comparison • FCR Performance • Targeted Opportunities
Top 10 First Call Resolution Practices… Hiring & Turnover • Hire for Customers versus Organization • FCR Profile • Stable Workforce
Top 10 First Call Resolution Practices… Call Flow • Service Standards (Journey) • Service Standards (Outcome) • Escalation Process • Call Flow Practices • Hold & Transfer can be Good • CSR Desk Top Applications
Top 10 First Call Resolution Practices… Recognition & Incentives • Best Performers • Most Improved Performers • Monthly Recognition • Financial Incentives • Quarterly Financial Payout • At Least 50% Financial Payout