M2-M5 Absolute Efficiency
This paper presents a comprehensive analysis of absolute efficiency in muon track reconstruction using data from various stations at CERN. Utilizing standalone reconstruction methods, the study examines clusters in the 5th station and their correlation with prediction models. By fitting the distributions of track predictions and employing advanced statistical methods, the authors calculate efficiencies for different regions, including considerations for background probability. Early evaluations indicate efficiencies exceeding 99% across most cases, with additional work required to understand inefficiencies in certain areas.


M2-M5 Absolute Efficiency
E N D
Presentation Transcript
Alessia, Roberta M2-M5 Absolute Efficiency R.Santacesaria, February 3, 2010- Muon meeting@CERN
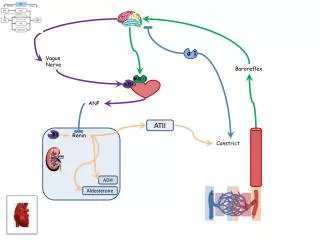
Efficiency calculation • Method: • - MuonTrackRec standalone reconstruction using 4 stations, • - Look for Clusters in the 5th station within large tolerances • around the prediction, no time cut • Assume the found cluster multiplicity distribution is due to efficiency + poissonian background • - Fit with this assumption • Data used: • - All existing beam TAE=2 events (92K) in range 63454-63990 • - All existing no-TAE events to increase statistics in some cases
Reconstructed tracks-TAE events Nev=92000 Reconstructed tracks with 4 stations • Ntr-sel: • - standalone tracks confirmed by the tracker requiring agreement • within 1s between the M1 hit and the Tracker extrapolated point on M1 In addition: On M2, where more physical noise is present, also: • only one track per event (avoid clone tracks) • < 10 pad/region • no Pad ambiguity within the TS, Only combinations (1X, >1 Y) or (>1X, 1Y) are kept On M5, further cuts were needed, not enough statistics remains go to no TAE events
Efficiency calculation Search window in the 5th station is ~ 6s where s isobtained by fitting the distributions of the difference between the prediction and the clusters Example of M4 x coordinate
Efficiency calculation Number of clusters found within the defined windows in M4 R2 R1 R4 R3
M4 k=# of clusters If k>0 SUM [(1-e) Pbgk e -Pbg/ k! + e Pbgk-1 e -Pbg/ k-1!] If k=0 SUM[ e -Pbg(1-e) ] Where SUM = Sum of the entries e = Efficiency P bg= Background probability Efficiency calculation From each histogram the efficiency e and the background probability Pbg Is extracted by fitting the following function: In this way the event correlated background is taken into account automatically since it is estimated in the vicinity of the track
Efficiency calculation Number of clusters found within the defined windows in M4 R2 R1 R4 R3
Efficiency calculation M4 This is efficiency in infinite time window M4R2 lower...
M4R2 xy coordinates of predictions where no clusters where found c Somewhat less efficient but no clear bad regions identified
Efficiency calculation M3 This is efficiency in infinite time window Lower efficiency of M3R2 is due to a particular chamber, excluding it e rises to normal values
M3R2 – Chamber 16A3 A side M3R2 xy coordinates of predictions where no clusters where found c In some cases hits on wires at the right place but no cathods are hit (double readout), it that region e<~85%
Efficiency calculation M2 This is efficiency in infinite time window - R1 slightly worse, probably due to leakage in the inner hole of R1. More work on the definition of the inner fiducial volume, prediction on M2 less well constrained since upstream Calo and M1
Efficiency calculation M2- no TAE events Due to additional cuts on M2 low statisticslook also at no TAE events This is the total efficiency, including 25ns time window • Bad e on R1 and R2 due to bad timing - OK for R2 after having excluded the corresponding Trigger Sectors - ~ OK for R1, some residual time misalignment is still present
Efficiency calculation M5 - no TAE • Further cuts to analyze M5 in order to define a penetrating track: • Tight matching of Tracker track extrapolated to M4 • P>8GeV • - Bad e on R1 due to a broken TTC • on one ODE . Better after having • excluded it • On R4 lower e due to softer spectrum of tracks reaching R4 Need to work with a bigger sample of high momentum tracks. Tighter cuts more statistics needed Clearly This is efficiency in 25 ns
Conclusions • - A first evaluation of the absolute efficiency gives results well above 99% • in almost all cases. • - A small clearly inefficient zone on M3R2 has been identified but • no explanation so far • - As far as efficiency in 25ns, eT, is well above 99% in M2R2-R4, still some residual time misalignment in M2R1 - More high momentum tracks are needed to analyze M5 • More work and more statistics to evaluate systematics - M1 efficiency to be done, big BG, different approach