Download
1 / 48
480 likes | 668 Vues
Australian Wine Marketing Conference. Wine Market Council Presentation July 16, 2001. Market Overview. Wine Market Council Presentation July 16, 2001. Total Table Wine Consumption. (Millions of cases). 202.9. 195.3. 188.0. 183.2. 176.0. 164.1. Source: Adams Business Media.

E N D
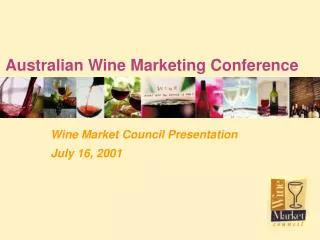
Australian Wine Marketing Conference Wine Market Council Presentation July 16, 2001
Market Overview Wine Market Council Presentation July 16, 2001
Total Table Wine Consumption (Millions of cases) 202.9 195.3 188.0 183.2 176.0 164.1 Source: Adams Business Media
Trends in Table Wine Consumption 7.2% 5.6% 4.5% 4.1% 3.9% 3.9% 2.5% -2.9% 1993 1994 1995 1996 1997 1998 1999 2000 Source: Adams Business Media
U.S. Adult Per Capita Table Wine Consumption v. Population Growth 194 184 173 164 154 147 Adult Population 134 2.58 2.53 2.29 2.13 1.96 1.78 Gallons per Adult 1.05 1970 1975 1980 1985 1990 1995 2000
Total Per Capita Consumption of Wine (1998) 15.3 13.7 5.2 3.8 2.4 2.0 Source: Adams Business Media
Consumer Segments 2000U.S. Adults 21 - Plus 80.8 (millions) 63.5 28.8 19.2 Core Marginal Non-Ad Non-Drkr Source: Merrill Research & Associates
Consumer Segments - 2000 U.S. Adults 21 - Plus Core 10% Non-Drinkers 42% Marginal15% Non-Adopters 33% Source: Merrill Research & Associates
Consumer Segments by Age (Percentages, Ages 21 - Plus) 26 25 25 24 21 19 16 15 15 14 Source: Merrill Research & Associates
Consumer Segments by Gender - 2000 Male 37% Male 36% Female 63% Female 64% Core Marginal Source: Merrill Research & Associates
Consumer Segments 2000U.S. Adults 21 - Plus % of % Wine Millions Sample Volume Core Wine Drinkers19.2 10 86 Marginal Wine Drinkers 28.9 15 14 Beer/Spirits Drinkers 63.5 33 0 Non-Drinkers 80.8 42 0 Total 192.4 100 100 Source: Merrill Research & Associates
Consumer Attitudes Wine Market Council Presentation July 16, 2001
Core Marginal Makes a good gift 98% 94% Like the taste 97% 90% Can buy w/o spending a lot 96% 90% Moderate use good for you 91% 85% Like to have on hand 88% 69% Associate wine w/fun times81% 71% Positive Attitudes - 2000 (Ages 21-Plus) Source: Merrill Research & Associates
Core Marginal Makes food taste better 81% 67% Open bottle stays fresh 2-3 days 59% 50% By-the-glass at reasonable price 50% 50% Don’t like to open bottle for self 35% 54% Never know brand to choose 28% 47% Don’t know which wine w/which food 20% 38% Too complicated 9% 23% Consumption Barriers - 2000 (Ages 21-Plus) Source: Merrill Research & Associates
Key Consumer Attitudes and Behaviors - 2000 (Ages 21-Plus) CoreMarginal Likes Wine 97% 90% Wine appropriate on 92% 83% most occasions Wine makes occasion formal38% 50% Drinks wine only on special occasions 9% 46% Source: Merrill Research & Associates
Consumer Trends 1994 - 2000 Wine Market Council Presentation July 16, 2001
Drink Wine Only on Special Occasions? (Ages 21-59) 58% 51% 46% 18% 12% 10% 1994 1997 2000 Source: Merrill Research & Associates
Drinking More vs Less Wine 28% 27% (Ages 21-59) 16% 3% 2% -13% 1994 1997 2000 Source: Merrill Research & Associates
Females as a Percentage of Core and Marginal Populations 64 62 (percentages) 60 55 55 55 Source: Merrill Research & Associates
Core and Marginal Population Trends 1994 - 2000 31.9 (Millions, 21-59) 25.7 23.5 16.7 16.2 15.7 1994 1997 2000 Source: Merrill Research & Associates
Prefer Table Wine vs Beer and Spirits? Percentages, ages 21 - 59 78 77 75 65 58 54 Source: Merrill Research & Associates
The Perfect Storm... Wine Market 2001, 2002, 2003?
Core and Marginal Population Trends 1994 - 2000 31.9 (Millions, 21-59) 25.7 23.5 16.7 16.2 15.7 1994 1997 2000 Source: Merrill Research & Associates
A National Campaign for Wine Wine Market Council Presentation July 16, 2001
Wine Market Council National Campaign • July 1, 2001 begins new WMC financial structure • First year budget $6 million - increasing by 50% each year over 3 to 5 year period • Producers and importers contribute 67%, growers 18%, wholesalers 15% • Each tier of trade has its own dues schedule
Wine Market Council National Campaign • Integrated, national campaign to increase wine consumption among marginal and low-core wine consumers • Public Relations • Internet • Advertising • Merchandising
Wine Market Council National Campaign • Public Relations • BSMG Chicago hired January 1 - agency for major campaigns from “Got Milk?” to Oscar Meyer • Comprehensive, national outreach to mainstream consumer media - placement of key messages • Launch and support for wineanswers.com
Wine Market Council National Campaign • Public Relations • Successful January launch of wineanswers.com with more than 21 million media impressions • Placements on ABC TV’s “The View,” major market network affiliates, drive-time radio, top daily metro newspapers
Wine Market Council National Campaign • Public Relations • Ongoing series of media initiatives throughout the year • Consumer impressions will total 60 to 75 million
Wine Market Council National Campaign • The Internet • Wineanswers.com as foundation for strategy • Site generates mainstream print and broadcast media features • Site becomes content provider to non-wine target sites rich in marginal audience
Partner Sites Consumer Media The Online Strategy wineanswers.com
Wine Market Council National Campaign • Advertising and Merchandising • Bozell Chicago at work on revised creative • Developmental steps completed by September, production in October, launch in 1st Quarter ‘02 • Supermarket and restaurant wine buyer Advisory Panel formed to drive merchandising initiatives
Total Table Wine Consumption (Millions of cases) 202.9 195.3 188.0 183.2 176.0 164.1 Source: Adams Business Media
Australian Wine Marketing Conference Wine Market Council Presentation July 16, 2001