Download
1 / 6
60 likes | 174 Vues
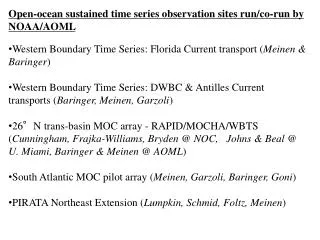
Open-ocean sustained time series observation sites run/co-run by NOAA/AOML Western Boundary Time Series: Florida Current transport ( Meinen & Baringer ) Western Boundary Time Series: DWBC & Antilles Current transports ( Baringer, Meinen, Garzoli )

E N D
Open-ocean sustained time series observation sites run/co-run by NOAA/AOML • Western Boundary Time Series: Florida Current transport (Meinen & Baringer) • Western Boundary Time Series: DWBC & Antilles Current transports (Baringer, Meinen, Garzoli) • 26°N trans-basin MOC array - RAPID/MOCHA/WBTS (Cunningham, Frajka-Williams, Bryden @ NOC, Johns & Beal @ U. Miami, Baringer & Meinen @ AOML) • South Atlantic MOC pilot array (Meinen, Garzoli, Baringer, Goni) • PIRATA Northeast Extension (Lumpkin, Schmid, Foltz, Meinen)
Western Boundary Time Series: • Florida Current transport • Funded by NOAA (in place since 1982) • Data are available in near-real-time (three day delay generally) • Expected to be funded continually Data available on the web: http://www.aoml.noaa.gov/phod/floridacurrent/ ~30 years of data online
26°N trans-basin array – MOC observations Trans-basin array is built from three programs: - Western Boundary Time Series: Cable & IES/PIES/CPIES funded by NOAA - Meridional Overturning Circulation Heat-flux Array: DHM/BPR funded by NSF - RAPID-MOC: DHM/BPR (& some gliders) funded by UK/NERC Data are available with varying time scales and formats via BODC & NOC web sites: Cable – near real time DHM & BPR – 6 month delay for processing ~ 5 years of data right now http://www.noc.soton.ac.uk/rapidmoc/
South Atlantic MOC: • Western boundary pilot array • Funded by NOAA (in place since 2009) • Project is a partnership with the Argentine Hydrographic Service and the Univ. of Buenos Aires (Piola & Troisi) • Both the Brazilian Hydrographic Service and the Univ. of Sao Paulo have also participated (Campos) • Operating in parallel to a similar program on the eastern boundary run by France & South Africa (Speich & Ansorge) • Expected to be funded continually (but will likely change once the complete trans-basin South Atlantic array is funded and deployed – see next slide)
South Atlantic MOC: Proposed trans-basin array Based on the recommendations of the US AMOC implementation plan and three international SAMOC workshops, an international group (US, France, Brazil, Argentina & South Africa) is proposing a complete trans-basin array for studying the MOC in the South Atlantic. Proposed array will be located along 34.5S will consist of a balanced array of approximately 20 instruments including dynamic height moorings*, PIES/PIES-DP/CPIES, and shorter direct velocity moorings on the shelves (proposed by US-NSF: Dong, Perez, Sprintall, Fine, Baker-Yeboah, Flierl; US-NOAA: Perez, Dong, Meinen, Garzoli, Baringer, Goni; France: Speich; S. Africa: Ansorge; Argetina: Piola; Brazil: Campos) * T, S, p (every 50 m in mixed layer, 200 m below), 3-5 current meters distributed throughout water column
PIRATA Northeast Extension • Funded by NOAA (in place since 2006) • Data are available in near-real-time • Expected to be funded continually • Moored buoy data is quality controlled and distributed by PMEL's TAO Project Office. • http://www.pmel.noaa.gov/tao/data_deliv/deliv.html This image shows the PIRATA backbone of buoys (red squares), the Northeast Extension (blue stars) led by the United States, the Southwest Extension (green circles) led by Brazil, the Southeast Extension pilot site (yellow triangle), and island-based observation sites (green crosses). Buoys with barometers and longwave radiometers are indicated with black circles.