
A Guide to User Testing: Ethics, Tasks, and Data Collection
E N D
Presentation Transcript
Hall of Fame or Hall of Shame? • frys.com
Hall of Shame • Does not follow OBVIOUS LINKS (K10) pattern • Navigation separate from content • no links on right • Why is this about Fry’s ISP? • I’m looking for a store!
Outline • Why do user testing? • Choosing participants • Designing the test • Administrivia • Collecting data • Analyzing the data
Jakob Nielsen Why do User Testing? • Can’t tell how good or bad UI is until? • people use it! • Other methods are based on evaluators who? • may know too much • may not know enough (about tasks, etc.) • Summary Hard to predict what real users will do
Choosing Participants ? • Representative of eventual users in terms of • job-specific vocabulary / knowledge • tasks • If you can’t get real users, get approximation • system intended for doctors ? • get medical students • system intended for electrical engineers ? • get engineering students • Use incentives to get participants
Ethical Considerations • Sometimes tests can be distressing • users have left in tear (embarrassed by mistakes) • You have a responsibility to alleviate • make voluntary with informed consent • avoid pressure to participate • let them know they can stop at any time [Gomoll] • stress that you are testing the system, not them • make collected data as anonymous as possible • Often must get human subjects approval • government contracts, academic settings
User Test Proposal • A report that contains • objective • description of system being testing • task environment & materials • participants • methodology • tasks • test measures • Get approved & then reuse for final report
Selecting Tasks ? • Should reflect what real tasks will be like • Don’t choose tasks that are too fragmented • e.g., phone-in bank test • Avoid bending tasks in direction of what your design best supports • Tasks from analysis & design can be used • may need to shorten if • they take too long • require background that test user won’t have
Deciding on Data to Collect • Two types of data • process data • observations of what users are doing & thinking • bottom-line data • summary of what happened (time, errors, success…) • i.e., the dependent variables • indpendent vs. dependent variables ?
Process Data vs. Bottom Line Data • Focus on process data first • gives good overview of where problems are • Bottom-line doesn’t tell you where to fix • just says: “too slow”, “too many errors”, etc. • Hard to get reliable bottom-line results • need many users for statistical significance • this is where automated online tools help
The “Thinking Aloud” Method • Need to know what users are thinking, not just what they are doing • Ask users to talk while performing tasks • tell us what they are thinking • tell us what they are trying to do • tell us questions that arise as they work • tell us things they read • Make a recording or take good notes • make sure you can tell what they were doing
Thinking Aloud (cont.) • Prompt the user to keep talking • “tell me what you are thinking” • Only help on things you have pre-decided • keep track of anything you do give help on • Recording • use a digital watch/clock • take notes, plus if possible • record audio and video (or even event logs)
Using the Test Results • Summarize the data • make a list of all critical incidents (CI) • positive & negative • include references back to original data • try to judge why each difficulty occurred • What does data tell you? • UI work the way you thought it would? • consistent with your walkthroughs? • users take approaches you expected? • something missing?
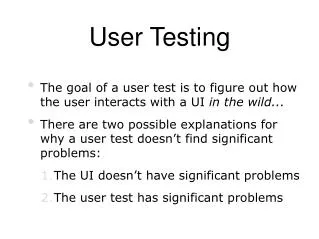
Using the Results (cont.) • Update task analysis & rethink design • rate severity & ease of fixing CIs • fix both severe problems & make the easy fixes • Will thinking aloud give the right answers? • not always • if you ask a question, people will always give an answer, even it is has nothing to do with the facts • panty hose example • try to avoid specific questions
Measuring Bottom-Line Usability • Situations in which numbers are useful • time requirements for task completion • successful task completion • compare two designs on speed or # of errors • Do not combine with thinking-aloud. Why? • talking can affect speed & accuracy (neg. & pos.) • Time is easy to record • Error or successful completion is harder • define in advance what these mean
Analyzing the Numbers • Example: trying to get task time <=30 min. • test gives: 20, 15, 40, 90, 10, 5 • mean (average) = 30 • median (middle) = 17.5 • looks good! • wrong answer, not certain of anything • Factors contributing to our uncertainty ? • small number of test users (n = 6) • results are very variable (standard deviation = 32) • std. dev. measures dispersal from the mean
Analyzing the Numbers (cont.) • This is what statistics is for • get The Cartoon Guide to Statistics • see class web page readings list for full cite • Crank through the procedures and you find • 95% certain that typical value is between 5 & 55 • Usability test data is quite variable • need lots to get good estimates of typical values • 4 times as many tests will only narrow range by 2x • breadth of range depends on sqrt of # of test users • this is when online methods become useful • easy to test w/ large numbers of users (e.g., NetRaker)
Measuring User Preference • How much users like or dislike the system • can ask them to rate on a scale of 1 to 10 • or have them choose among statements • “best UI I’ve ever…”, “better than average”… • hard to be sure what data will mean • novelty of UI, feelings, not realistic setting, etc. • If many give you low ratings -> trouble • Can get some useful data by asking • what they liked, disliked, where they had trouble, best part, worst part, etc. (redundant questions)
B A Comparing Two Alternatives • Between groups experiment • two groups of test users • each group uses only 1 of the systems • Within groups experiment • one group of test users • each person uses both systems • can’t use the same tasks or order (learning) • best for low-level interaction techniques • Between groups will require many more participants than a within groups experiment • See if differences are statistically significant • assumes normal distribution & same std. dev.
Experimental Details • Order of tasks • choose one simple order (simple -> complex) • unless doing within groups experiment • Training • depends on how real system will be used • What if someone doesn’t finish • assign very large time & large # of errors or throw out data (note) • Pilot study • helps you fix problems with the study • do 2, first with colleagues, then with real users
Instructions to Participants [Gomoll] • Describe the purpose of the evaluation • “I’m testing the product; I’m not testing you” • Tell them they can quit at any time • Demonstrate the equipment • Explain how to think aloud • Explain that you will not provide help • Describe the task • give written instructions, one task at a time
Details (cont.) • Keeping variability down • recruit test users with similar background • brief users to bring them to common level • perform the test the same way every time • don’t help some more than others (plan in advance) • make instructions clear • Debriefing test users • often don’t remember, so demonstrate or show video segments • ask for comments on specific features • show them screen (online or on paper)
Reporting the Results • Report what you did & what happened • Images & graphs help people get it!
Summary • User testing is important, but takes time/effort • Early testing can be done on mock-ups (low-fi) • Use ????? tasks & ????? participants • real tasks & representative participants • Be ethical & treat your participants well • Want to know what people are doing & why, so? • collect process data • Using bottom line data requires ???? to get statistically reliable results • more participants • Difference between between & within groups? • between groups everyone does particpates in one condition • within groups: everyone participates in multiple conditions