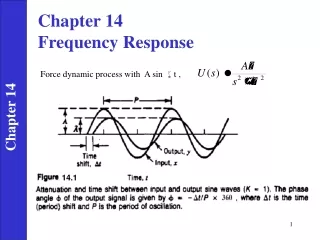
Chapter 14 Frequency Response
Learn about transfer functions, decibel scale, Bode plots for magnitude and phase, resonant circuits, passive and active filters, and scaling in circuit analysis. Apply knowledge to radio receivers and touch-tone telephones.

Chapter 14 Frequency Response
E N D
Presentation Transcript
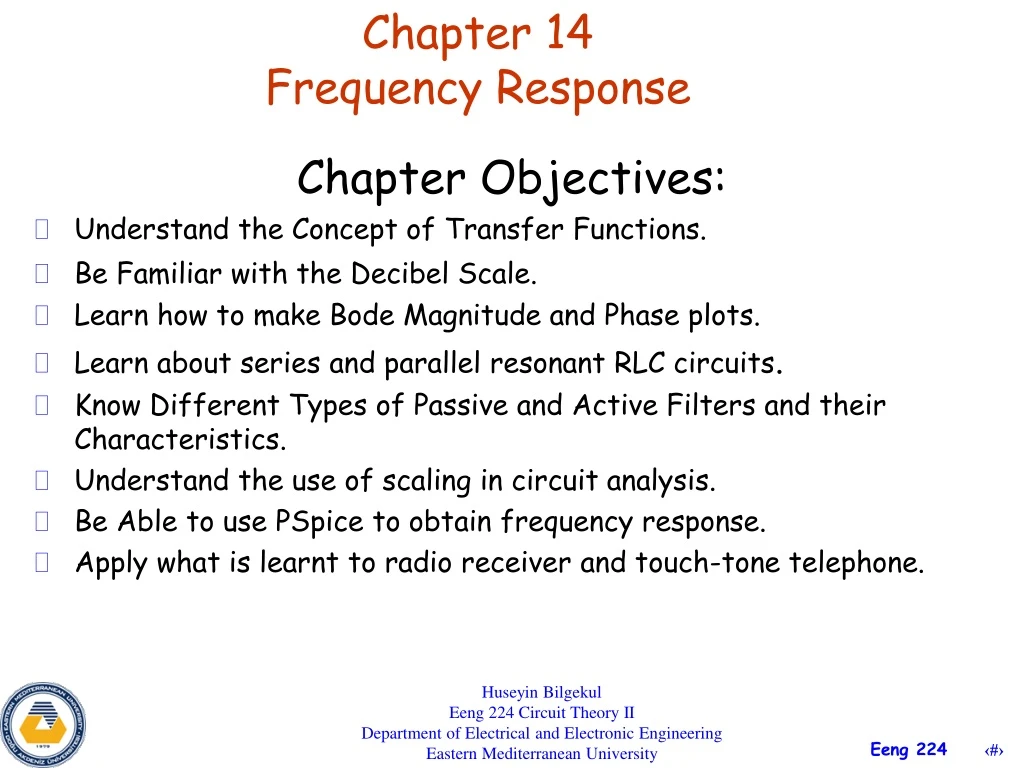
Chapter 14Frequency Response Chapter Objectives: • Understand the Concept of Transfer Functions. • Be Familiar with the Decibel Scale. • Learn how to make Bode Magnitude and Phase plots. • Learn about series and parallel resonant RLC circuits. • Know Different Types of Passive and Active Filters and their Characteristics. • Understand the use of scaling in circuit analysis. • Be Able to use PSpice to obtain frequency response. • Apply what is learnt to radio receiver and touch-tone telephone. Huseyin Bilgekul Eeng 224 Circuit Theory II Department of Electrical and Electronic Engineering Eastern Mediterranean University
DECIBEL SCALE • The DECIBEL provides us with a unit of less magnitude.
DECIBEL SCALE • The DECIBEL value is a logarithmic measurement of the ratio of one variable to another of the same type. • Decibel value has no dimension. • It is used for voltage, current and power gains.
BODE PLOTS • Bode plots are APPROXIMATEsemilog plotsof the magnitude (in Decibels) and phase (in degrees) of a transfer function versus frequency. They are much easier to plot. High pass filter circuit magitude response. Bode plots are APPROXIMATE plots of the magnitude and phase responses.
BODE PLOTS BODEPLOT Actual Response
BODE PLOTS Bodeplot and actual magnitude and phase responses of the RC high pass filter circuit.
BODE PLOTS • Bode plots aresemilog plotsof the magnitude (in Decibels) and phase (in degrees) of a transfer function versus frequency.Bode plots carry same information. They are much easier to plot. Decibel values Logarithmic axis Total Magnitude Response
BODE PLOTS • A transfer function may be written in terms of factors that have real and imaginary parts. • This representation is called the STANDARD FORM. It has several different factors.We can draw the Bode plots by plotting each of the terms of the transfer function separately and then adding them.The different factors of the transfer function are 1.)Gain termK.2.)A pole (j)-1 or a zero (j) at the origin.3.)A simple pole or zero 4.)A quadratic pole or zero
BODE PLOTS, The Decade • A DECADE is an interval between 2 frequencies with a ratio of 10 (between 10 Hz and 100 Hz or between 500 Hz and 5000 Hz). 20 dB/decade means that magnitude changes 20 dB whenever the frequency changes tenfold or one decade.The DC value (ω→ 0) does not appear on Bode plots ( Log0 = - ∞). • Slopes are expressed indB/decade. 20 dB One Decade
BODE PLOTS • To plot the Bode plots of a given transfer function.1.)Put the transfer function in STANDARD FORM.2.)Write the Magnitude and phase equations from the STANDARD FORM.3.)Plot the magnitude of each term separately.4.)Add all magnitude terms to obtain the magnitude transfer function.5.)Repeat 2-4 for the phase response.6.) The total magnitude response in Decibel units is the summation and subtraction of the responses of different terms.7.) The total phase response in degrees is the summation and subtraction of the phase responses of different terms.
BODE PLOTS • We examine how to plot different terms that may appear in a transfer function. The total response will be obtained by adding all the responses. CONSTANT TERM
BODE PLOTS ZERO AT THE ORIGIN POLE AT THE ORIGIN -20 -90
SIMPLE ZERO • Approximate the magnitude response of a simple zero by two linear curves before and after ω=z1Approximate the phase response of a simple zero by three linear curves before ω=0.1z1 after ω=10z1 and between ω=0.1z1 and ω=10z1 CORNER FREQUENCY BREAK FREQUENCY 3 dB FREQUENCY
SIMPLE POLE • Approximate the magnitude response of a simple pole by two linear curves before and after ω=p1Approximate the phase response of a simple pole by three linear curves before ω=0.1p1 after ω=10p1 and between ω=0.1p1 and ω=10p1 • NOTICE the pole and zero responses are in opposite directions. CORNER FREQUENCY -20 -90
EXACT RESPONSE OF QUADRATIC POLE BODE PLOTS
BODE PLOT OF QUADRATIC ZERO • The EXACT responses can be approximated by BODE plots in terms of the corner frequency ωn
Procedure for Bode plot Construction • Express transfer function in Standard form. • Find the Pole and Zero frequencies. • Express the magnitude and phase responses. • Sketch each term of the magnitude and phase responses. • Add each term of magnitude response to find total magnitude response. • Add each term of phase response to find total phase response. • Another Procedure • Zeros cause an increase and poles cause a decrease in the slope . • Start with the lowest frequency of the Bode plot. • Move along the frequency axis and increase or decrease the slope at each corner frequency. • Repeat the same procedure for both the magnitude and the phase.
EXAMPLE 14.3 Construct Bode plots for • Express transfer function in Standard form. • Express the magnitude and phase responses. • Two corner frequencies at ω=2, 10 and a zero at the origin ω=0. • Sketch each term and add to find the total response.
EXAMPLE 14.3 Construct Bode plots for 26 dB X X X X
EXAMPLE 14.3 Continued: Let us calculateH and at =50 rad/sec graphically. 26 dB =50 =50
EXAMPLE 14.4 Construct Bode plots for • Express transfer function in Standard form. • Express the magnitude and phase responses. • Two corner frequencies at ω=5, 10 and a zero at ω=10. • The pole at ω=5 is a double pole. The slope of the magnitude is -40 dB/decade and phase has slope -90 degree/decade. • Sketch each term and add to find the total response.
PRACTICE PROBLEM 14.6 Obtain the transfer function for the Bode plot given.