Motion Graphs
Motion Graphs. Describing the motion of an object is occasionally hard to do with words. Sometimes graphs help make motion easier to picture, and therefore understand. GRAPHS. • Motion is a change in position measured by distance and time.

Motion Graphs
E N D
Presentation Transcript
Describing the motion of an object is occasionally hard to do with words. Sometimes graphs help make motion easier to picture, and therefore understand. GRAPHS
• Motionis a change in position measured by distance and time. • • Speedtells us the rate at which an object moves. • • Velocitytells the speed and direction of a moving object. • •Acceleration tells us the rate speed or direction changes. Remember:
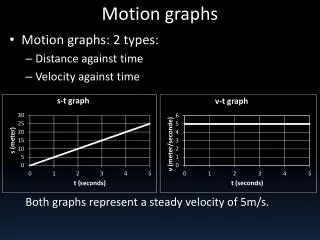
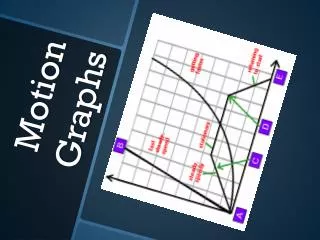
Plotting distance against time can tell you a lot about motion. Let's look at the axes: DISTANCE-TIME GRAPHS Time is always plotted on the X-axis (bottom of the graph). The further to the right on the axis, the longer the time from the start. Distanceis plotted on the Y-axis (side of the graph). The higher up the graph, the further from the start.
If an object is not moving, a horizontal line is shown on a distance-time graph. At Rest Time is increasing to the right, but its distance does not change. It is not moving. We say it is At Rest.
If an object is moving at a constant speed, it means it has the same increase in distance in a given time: Time is increasing to the right, and distance is increasing constantly with time. The object moves at a constant speed. Constant speed is shown by straight lines on a graph. Constant Speed
Let’s look at two moving objects: Both of the lines in the graph show that each object moved the same distance, but the steeper dashed line got there before the other one: Higher Speed A steeper line indicates a larger distance moved in a given time. In other words, higher speed. Both lines are straight, so both speeds are constant.
Graphs that show acceleration look different from those that show constant speed. Acceleration The line on this graph is curving upwards. This shows an increase in speed, since the line is getting steeper: In other words, in a given time, the distance the object moves is change (getting larger). It is accelerating.
A distance-time graph tells us how far an object has moved with time. • The steeper the graph, the faster the motion. • A horizontal line means the object is not changing its position - it is not moving, it is at rest. • A downward sloping line means the object is returning to the start.