Bacterial Chemotaxis
610 likes | 839 Vues
Explore how bacteria swim towards food, detect sources, control movement, and adapt chemotactic strategies in their environment. Understand the role of bacterial flagella, external polymers, and chemotaxis mechanisms.

Bacterial Chemotaxis
E N D
Presentation Transcript
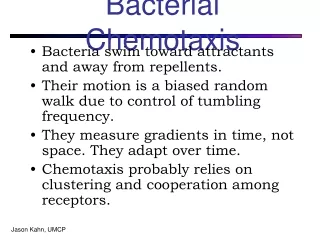
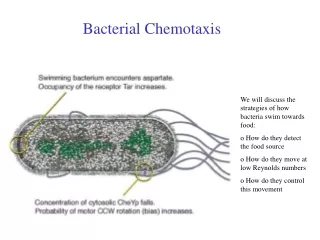
Bacterial Chemotaxis We will discuss the strategies of how bacteria swim towards food: o How do they detect the food source o How do they move at low Reynolds numbers o How do they control this movement
Chemotaxis Definition : „The directed motion of organisms towards or away from chemical attractants or repellents.“ Chemotaxis of bacteria:Salmonella typhimurium are attracted by Serin (left) and repelled by Phenol (right) The amoeba Dictyostelium Discoideum runs towards increasing concentrations of cAMP.
External Polymers in Bacteria Typically, two different External Polymers are found in Bacteria: o Bacteria can move with Pili by extending and retracting them inside the cell body (Type IV pilia). They are used to glue bacteria to each other to form biofilms, connect different bacteria for exchanging plasmids or let them attach to surfaces. o Flagella are used to swim. Often, Bacteria have several Flagella.
Flagella Motor Bacteria swim with the help of Flagella (Geißel) which are rotated by transmembrane motors. A Flagella can rotate with up to 150 turns per second.
Bacteria move by rotating the Flagella At small scales, viscosity of water dominates and effects by inertia are absent. Thus swimming strategies are very much different from what we know at large scales. A good strategy is to swim by "drilling holes with a screw".
Moving and Tumbling Bacteria Depending on the Rotation direction, several Flagella either form a bundle and allow forward simming or they "repell" each other and block swimming. The latter is due to inward propagation of interaction defects, given by the geometry of the flagella.
Moving and Tumbling Bacteria From: Real-Time Imaging of Fluorescent Flagellar Filaments, LINDA TURNER, WILLIAM S. RYU, AND HOWARD C. BERG, JOURNAL OF BACTERIOLOGY, May 2000, p. 2793–2801
Strategy of Chemotaxis • E. coli Bacteria have efficient molecular motors for locomotion • They move by switching between direction runs and random tumble motions.
Bacteral Chemotaxis The bacterial flagella are arranged into bundles which diverge into separate bundles when they drive clock wise (CW) and converge to a single bundle when they are rotating counter clockwise (CCW). The Bacteria thus has two states of motion (A) swimming in a straight line (v=14-30m/sec, in average for 0.8s) and (B) tumble, in average for 0.2s. If for the bacteria the concentratrion of an attractant increases over time, tumbling is suppressed. As result, the bacteria performs a biased diffusion process towards increasing concentration of the attractant.
Run and Tumble Movement The movement of E.coli is a sequence of straight movements, followed by short phases of reorientations. This Run and Tumble movement can be described as diffusion process with an exponential distributed step length vt. It yields the effective diffusion coefficient: Run velocity v, Average run time Orientation factor a. The orientation factor a describes the average reorientation after each tumble phase =<cos>. Equal distributions into all directions (random walk) equals =0, no reorientation =1. With v=30m/sec and = 0,8sec, =0 one obtains DST=240 µm2/sec. For comparison: small biomolecules (sugars, peptides etc.) : D=400 µm2/sec !!!
Mechanism of average chemotactic drift The temporal increase of the attractant concentration leads to an temporary extension of the run phase. As result, the random walk is unbalanced and we obtain an average drift velocity into the direction of higher concentration of the attractant. => Biased Random Walk Constraints: - only~ 1,000receptors - only1 sto evaluate concentration Performance: - can detect < 1%change of occupancy - can operate over 5 orders of magnitude in ambient concentration
Optical Methods: Optical Tweezer Ecoli in water.avi
Tethering on Substrates Ecoli tethered.avi
System Characteristics of the biological Network • Measurement of relative concentrations over time, not absolute concentration • Exact adaptation • Sensitivity by Amplification • Combination of signals from attractants and repellants. The range of concentrations which triggers chemotaxis ranges over 5 orders of magnitude (nM->mM) !
Input : Attraktorconcentration Output :Tumble movement
The intracellular signal network From genetic analysis, four cytoplasmatic proteins CheA, CheW, CheY and CheZ are known to connect the chemotactic receptors with the flagella motor. CheW: Regulator CheA : Proteinkinase CheY : Response Regulator CheZ : Phosphatase-activating Protein Regulated by the receptor, CheA transfers a phosphorylation onto the small CheY protein. CheY-p diffuses to the motor protein and induces a transition towards the tumble movement.
The intracellular signal network Phosphorylation is the addition of a phosphate (PO4) group to a protein molecule or a small molecule. Reversible phosphorylation of proteins is an important regulatory mechanism. Enzymes called kinases (phosphorylation) and phosphatases (dephosphorylation) are involved in this process. Many enzymes are switched "on" or "off" by phosphorylation and dephosphorylation. Reversible phosphorylation results in a conformational change in the structure in many enzymes. For example, phosphorylation replaces neutral hydroxyl groups on serines, threonines or tyrosines with negatively charged phosphates with pKs near 1.2 and 6.5. Thus, near pH 6.5 they add 1.5 negative charges and above pH 7.5 they add 2 negative charges. It is estimated that 1/10th to 1/2 of proteins are phosphorylated (in some cellular state). A phosphorylated serine residue (from: http://en.wikipedia.org/wiki/Phosphorylation
The intracellular signal network CheR : Methyltransferase CheB : Methylesterase The receptors become more sensitive with its methylation. The methylation is performed by the protein CheR, the desensitising demethylation the phosphorylated p-CheB. The phosphorylation of CheB is triggered by CheA. This results in a negative feedback loop. Activated receptors become less sensitive via CheA und p-CheB. Methylation denotes the attachment or substitution of a methyl group on various substrates. Besides DNA methylation, typically at CpG sequence sites, Protein methylation typically takes place on arginine or lysine amino acid residues. Arginine can be methylated once or twice, Lysine can be methylated once, twice or three times. Protein methylation is one type of post-translational modification. From: http://en.wikipedia.org/wiki/Methylation
The intracellular signal network Phosphorylation is the addition of a phosphate (PO4) group to a protein molecule or a small molecule. Reversible phosphorylation of proteins is an important regulatory mechanism. Enzymes called kinases (phosphorylation) and phosphatases (dephosphorylation) are involved in this process. Many enzymes are switched "on" or "off" by phosphorylation and dephosphorylation. Reversible phosphorylation results in a conformational change in the structure in many enzymes.
Bakteria adapt their signal response After addition of an attractant at t=0: The frequency of tumbling reduces very fast. After an adaptation time t the frequency increases and levels out at the previous value. Advantage: A bacteria can detect the change of an attractant over a very large range of concentrations: from 10-10 M to 10-3 M. unstimulated cells System response is fast <200ms, Adaptation slow (10 minutes) cells stimulated at time t =0
Adaption under changed concentration of CheR The precision of adaptation does not depend on the concentration of CheR CheR is increased by expression from a plasmid under the external control of a Lac Operon.
Adaption under changed concentration of CheR Die Adaptionspräzision ist unabhängig von CheR CheR is increased by expression from a plasmid under the external control of a Lac Operon.
Comparision with Integral feedback control Doyl (1999) The shown feedback control amplifies u into an output y. This is reduced via intragal feedback slowly to zero. (see integral part of PID controllers) u: Input signal (conc. of attractant) x: Integral feedback (Amount of Methylation) y0: Desired size y1-y0: deviation y: Output signal (Receptor activity)
The intracellular signal network From genetic analysis, four cytoplasmatic proteins CheA, CheW, CheY and CheZ are known to connect the chemotactic receptors with the flagella motor. CheW: Regulator CheA : Proteinkinase CheY : Response Regulator CheZ : Phosphatase-activating Protein Regulated by the receptor, CheA transfers a phosphorylation onto the small CheY protein. CheY-p diffuses to the motor protein and induces a transition towards the tumble movement.
The signal transfer function is very steep Hill coefficient 10
The signal transfer function is very steep Hill Equation Binding a ligand to a receptor is often enhanced if there are already other ligands present (cooperative binding). The Hill coefficient, provides a way to quantify this effect, initially used for O2-binding to Hemoglobin. θ - fraction of ligand binding sites filled [L] - ligand concentration Kd - dissociation constant Hill coefficient n. Describes the cooperativity of ligand binding: n > 1 - Positively cooperative reaction: Once one ligand molecule is bound to the enzyme, its affinity for other ligand molecules increases. n < 1 - Negatively cooperative reaction: Once one ligand molecule is bound to the enzyme, its affinity for other ligand molecules decreases. n = 1 - Noncooperative reaction: Independent binding to the receptor. Same as Langmuir equation. Hill coefficient 10
Measurement of Motor signal transduction Cluzel et al.
Green-fluorescent Protein Green fluorescent protein (GFP) From jellyfish Aequorea victoria The three amino acids form the GFP chromophore GFP can be genetically linked to other proteins ("fused"). Cluzel et al. have constructed CheY-P–GFP under the control of a Lac promotor.
Fluorescence Correlation allows the calibration of the protein concentration inside a cell
The signal transfer function is very steep On-Off characteristic, Amplification factor 10 Total amplification 60 (bei Front-end Verstärkung 3-5) Hill coefficient 10
-> Slides from Talk of Tom Duke, Cavendish Laboratory, UK
Signal processing by clusters of membrane receptors Tom Duke Cavendish Laboratory Ian Graham Dennis Bray Anatomy Department University of Cambridge
Protein network unstimulated stimulated CW CCW
Protein network unstimulated stimulated adapted
Exact adaptation • Barkai & Leibler ‘97 • If modification enzyme Che B binds only to active receptors, steady-state activity is • independent of ambient concentration • Robust, exact adaptation signal response concentration activity
Exact adaptation • Barkai & Leibler ‘97 • If modification enzyme Che B binds only to active receptors, steady-state activity is • independent of ambient concentration • Robust, exact adaptation • Separation of time scales: • conformational transition 10-5 s ? • ligand release 10-3 s • phosphorylation 10-1 s response time • methylation 10 s adaptation time signal response concentration activity
Protein network unstimulated stimulated adapted Step 1: Introduction of two conformation states of the receptor: active and inactive Step 2: Let these conformations couple to neighboring receptors
Two-state ligand-binding protein • ligand binds more strongly to inactive state inactive (-) active (+) EA unbound -EA bound
Two-state ligand-binding protein • ligand binds more strongly to inactive state • mean activity depends on ligand concentration inactive (-) active (+) EA unbound -EA bound - Chemical potential of bound ligand Probability of inactive state Parallel to binding, receptors become inactive (-): Fast way to some sort of 'adaption' behaviour
Simple model:thermodynamics • for the symmetric case • the adapted system with P(si)=0.5 has Consider different receptors i with three states: -1 inactive +1 active si= unbound 0 unliganded 1 liganded li= 0 unmodified 1 modified mi= bound unmodified modified
Simple model:sensitivity to fractional change in concentration EL • Sensitivity of adaptedsystem change in ligand occupancy • depends on shape of ligand-binding curve Occupancy PL c/Kd
Model:sensitivity to fractional change in concentration • Sensitivity of adaptedsystem change in ligand occupancy • depends on shape of ligand-binding curve EL Sensitivity Occupancy PL c/Kd
Conformation-dependent coupling • Shi & Duke ‘99 • Receptors are clustered together • energy reduced by J if neighbour in same conformation • random field Ising model: possible phase transition atJ = J*