Download
1 / 36
360 likes | 549 Vues
Bacterial chemotaxis lecture 2 Manipulation & Modeling Genetic manipulation of the system to test the robustness model Explaining Ultrasensitivity and the wide range of sensitivity. Falk and Hazelbauer (2001) TIBS 26, 257. Questions to address. Do we know all the components?.

E N D
Bacterial chemotaxis lecture 2 Manipulation & Modeling Genetic manipulation of the system to test the robustness model Explaining Ultrasensitivity and the wide range of sensitivity.
Questions to address Do we know all the components? Do we know all the biochemical parameters needed for modeling? Can we explain the precision of adaptation vs variation in timing? How do these properties depend on the system parameters? Can we account for cell to cell variation in chemotaxis? Where does the impressive amplification come from? How does the motor work? How are flagellar transitions coordinated? How did this complex and beautiful system evolve
Simplified adaptation model with the key assumption that CheB can only demethylate the active form of the receptor/kinase complex. In this model, when fewer receptors are active due to an acute increase in ligand binding, CheB has less substrate available so demethylation is slowed while methylation (CheR) is constant resulting in a net increase in receptor methylation over the next few minutes. Since methylation stabilizes the activation state of the receptor (even when ligand is bound), the net activation ultimately returns to the original value. This model argues that availability of “active” receptor substrate for CheB is more important for perfect adaptation than is the phosphorylation state (activity) of CheB. Barkai&Leibler 1997 Naure 387, 913
Assumptions in Baraki&Leibler adaptation model: Notice that the ability of active receptors to cause phosphorylation of CheB and inactivate CheB is not considered in this model (VBmax is treated as a constant). Thus, this regulation is not required for perfect adaptation. If considered, this regulation would be predicted to increase the steady state fraction of active receptors but the system would still exhibit perfect adaptation. Ast = KbVRmax/(VBmax-VRmax) But now, VBmax(t) = kphosA(t) - kdephos At steady state, VBmax(st) = kphosAst - kdephos Since the system perfectly adapts, VBmax(st) is a constant
The model predicts that increasing the amount of CheR (methylase) from 100 to 300 molecules/cell increases the fraction of active receptors at steady state (Activity) resulting in a larger fraction of time spent tumbling and also resulting in a shorter time required to recover following addition of ligand. 100 300 Consistent with simplified model Ast = KbVRMAX/(VBMAX-VRMAX) = KbVRMAX/VBMAX for VBMAX>>VRMAX It can also be shown that t 1/VRMAX (see Alon Chapter exercises) Thus, substituting for VRMAX, t Kb/VBMAXAst Barkai&Leibler 1997 Naure 387, 913
Barkai-Leibler Model is a form of Integral Control Yi, Huang, Simon&Doyle 2000 PNAS 97, 4649 In the classic integral control model (on right), applied to bacterial chemotaxis, u is the fraction of receptors that are not bound to ligand (the external perturbation) and x is the fraction of receptors that are not methylated due to demethylation of active receptors by CheB (the response). y1 is the resulting activity state of the receptor, which is linearly related to the fraction of receptors unbound minus the fraction of receptors demethylated y1= k(u-x) (e.g. methylated and unbound receptors have the highest probability of being active). k is a positive constant relating the total activity of the receptors to the fraction unoccupied and methylated. y0 is the steady state level of y1. At steady state, y1 = y0 KbVRmax/(VBmax-VRmax) (from Barkai&Leibler) a function only of CheR and CheB binding and turnover numbers - independent of ligand concentration. y is defined as the difference between the activity at time t (y1) and the activity at steady state (y0). Thus, at steady state, y = 0. Decreased ligand binding acutely increases u and elevates y1 to a value above y0, giving a transient positive value for y.
Barkai-Leibler Model is a form of Integral Control t 0 Yi, Huang, Simon&Doyle 2000 PNAS 97, 4649 At steady state, (y = 0) the rate of methylation and demethylation are equal. If one assumes for simplicity (as did Barkai&Leibler) that CheR is saturated and unaffected by ligand binding and that the CheB demethylase only acts on active receptors (whether or not ligand is bound) then the netrate of demethylation at any instantaneous time will be directly proportional to y (the transient excess in active receptors over the steady state value). When y = 0 methylation and demethylation cancel out. The fraction of demethylated receptors (x) at any time t is then determined by the number of receptors in the demethylated state at time zero, x0 (e.g. prior to the unbinding perturbation) plus the number of receptors that get demethylated during the interval in which the system was perturbed. This latter term is the integral from the time at which the perturbation (e.g. ligand unbinding) occurred t=0 to time t of ydt. So x(t) = x0 + ydt Notice that y can be + or - depending on whether ligand decreases or increases. Thus dx/dt = y = k(u-x) - y0 At steady state, dx/dt=y=0 and y1=y0 Notice that since k and y0 are constants, an increase in u (rapid release of ligand) is ultimately offset by a slow decrease in x so that at steady state k(u-x) = y0.
Assumptions/simplifications in integral model: CheB only acts on active receptors (essential for perfect adaptation with robustness). The activity of the unmethylated receptor is negligible compared to methylated. The binding of methylase CheR to receptors is not affected by ligand binding. The Vmax values of the methylase and demethylase are independent of receptor occupancy or methylation state. Variations from these assumptions compromises perfect adaptation.
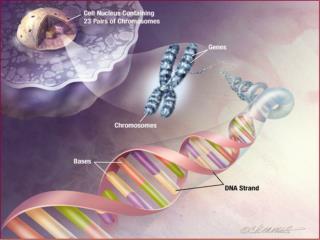
The basics of chemotaxis • Receptor:CheW:CheA phosphorylates CheY • Phosphorylated CheY interacts with motor to promote CW rotation and tumble • CheY dephosphorylated by CheZ • Attractant binding reduces CheA activity -> less CheY-P -> rarer tumbling • Repellent binding increases CheA activity -> more CheY-P -> more tumbling • Adaptation via control of methylation: • Ligand binding and receptor methylation jointly control CheA activity • At given ligand occupancy, more methylation -> more CheA activity • At given methylation level, more attractant (less repellent) binding -> less CheA activity • CheA phosphorylates and activates CheB, the receptor methylase • Attractant -> Less CheA activity -> Less CheB-P -> more methylation ->more CheA activity • Repellent -> More CheA activity -> More CheB-P -> Less methylation ->Less CheA activity • Effectively the system measures the difference between the extent of two processes: • Fast ligand binding • Slow receptor methylation/demethylation • When [attractant] changes fast, the two signals show a large difference & cells respond
1. A model is only useful if it makes predictions that can be tested by experimentation. The most useful experiments for testing a model involve making quantifiable changes in the concentrations of individual components and monitoring the consequent time-dependent changes in system behavior. Models for biological systems can never be proven. For every simple model it is always possible to imagine a complex model that works equally well . Thus one must always chose the simplest model (fewest parameters) that adequately explains the behavior of the system. Experiments should always be designed to disprove the model, not to support the model.
Experimental data to test robustness of adaptation Alon, Surette, Barkai and Leibler, 1999 Nature 397, 168 Adaptation time for wild type E. coli 1 mM aspartate added at time 0 (open circles) Mock addition (squares). Notice perfect adaptation
Experimental data to test robustness of adaptation Alon, Surette, Barkai and Leibler, 1999 Nature 397, 168 Cells lacking CheR do not tumble (triangle). Addition of various levels of CheR back to E. coli lacking the CheR gene results in a hyperbolic increase in the steady state tumbling ratio (consistent with Barkai&Leibler model -equation below). The adaptation time (in response to 1 mM aspartate) decreases with CheR expression (also consistent with model) but the adaptation precision is nearly perfect at all CheR as long as CheR is not zero (upper graph). tumbling t At low receptor activation, the steady state tumbling rate is proportional to steady state receptor activation (Ast) which is predicted to increase with increasing CheR (VRmax in the equation below): Ast = KbVRmax/(VBmax-VRmax) assuming VBmax>VRmax and other simplifications
Experimental data to test robustness of adaptation Alon, Surette, Barkai and Leibler, 1999 Nature 397, 168 Effect of varying expression of Che proteins on behavior Fold Expression Conclusion: In agreement with the Barzai&Leibler model, the precision of adaptation is robust even when Che protein levels vary by an order of magnitude. However, adaptation time and tumbling frequency change considerably.
Inconsistent with simple hyperbolic or sigmoidal saturation of receptor binding 990-1000 Receptor Occupation 99-100 9.9-10 E F C D A B A B C D E F [Attractant] • Ultrasensitivity to a wide range of chemoattractants Bacteria can respond to small differences (<1% front to back) in chemoattractant concentration over a very large (1000 fold) range of basal concentrations. Given what we know about receptor saturation, how can this work?
0 0.1 .5 5 S=27 S=36 0 0.1 5 .5 Controllable Amplification Cells initially at 0, 0.1, .5, 5 mM MeAsp Add indicated [MeAsp] Measure fold decrease in response as a function of the change in [MeAsp] (lower) After adaptation to the new [MeAsp], restore [Asp] to initial value and monitor the increase in tumbling frequency (upper curves) Sourjik, V., et al. (2002). Proc Natl Acad Sci U S A 99: 123-7.
Increasing the level of phosphorylated-CheY results in increased tumbling frequency Alon et al., 1998 EMBO J. 17, 4238
Ultrasensitivity of the flagellar motor to changes in phospho-CheY Cluzel, Surette and Leibler (2000) Science 287, 1652
Fluorescence Correlation Spectroscopy allows a determination of the concentration of a fluorescent molecule (protein), as well as the diffusion rate. See Elson, 2001 Traffic 2, 789 The average fluorescence (over time) detected when a laser beam is focused on a small subcompartment of the cell is given by<F> = Q<n> = Qmwhere n is the number of molecules in the subcompartment at a particular time, m is the average number of particles (over time) and Q is a constant characteristic of the quantum yield of the fluorophore and the sensitivity of the detection system. Molecules will enter and leave the volume resulting in fluctuations in the fluorescence intensity (see graph A). The probability that there will be n molecules in the defined volume at any particular time can be predicted by the Poisson distribution: P(n) = mnexp(-m)/n!and for this distribution, the variance can be shown to be<(n-m)2> = m The fluorescence fluctuation autocorrelation function G(t) is defined as the fluctuation of the fluorescence from the average fluorescence at time t multiplied by the fluctuation at time t+t and then averaged over many points on the fluorescence intensity output (Graph A): Fluorescence Intensity <F> G(t) = LimN->infinityi=1SN[F(it)-<F>][F(it+t)-<F>] Thus, G(t) = Q2LimN->infinityi=1SN[n(it)-m][n(it+t)-m] Notice that when t = 0, G(0) = Q2<(n-m)2> = Q2m If one divides by the square of the average fluorescence intensity, the Q2 term drops out: this normalized value G(0) is often used to define the autocorrelation function. G(0)/<F>2 = G(0) = 1/m Thus, the inverse of G(0) provides the number of molecules in the volume under investigation. It can also be shown that G(t) is related to the diffusion constant D of the fluorescent molecule and the radius of the laser beam by the equation in Graph B. G(t) = 1/{m[1+(4Dt/w2)]}
Ultrasensitivity of the flagellar motor to changes in phospho-CheY Cluzel, Surette and Leibler (2000) Science 287, 1652 Fluorescence correlation spectroscopy allows a determination of the number of fluorescent molecules in a given volume visualized by a laser beam from the fluctuation in fluorescence intensity in the detection volume with time G(t) = 1/{m[1+(4Dt/w2)]}where m is the number of molecules in the detection volume, D is the diffusion constant and w is the radius of the detection volume.
Ultrasensitivity of the flagellar motor to changes in phospho-CheY Cluzel, Surette and Leibler (2000) Science 287, 1652 Clockwise bias (direction for tumbling) increases in a sigmoid fashion in response to increased CheY-P. The rate of switching from CW to CCW is highest at the CheY-P concentration that gives 50% maximal response. A fit to the data gives a Hill coefficient of ~10
A MWC model for phospho-CheY binding to a cluster of ~30 coupled receptors Alon et al., 1998 EMBO J. 17, 4238 Assumptions: The receptor cluster exists in two states (favoring CCW or CW rotation of the motor). In the absence of phospho-CheY, the receptor cluster is in a conformation driving CCW rotation (swimming). Binding one phospho-CheY proteins makes the CCW conformation less favorable by a factor of y. Saturation of receptors with phospho-CheY strongly stabelizes the CW rotation (tumbling).
Bray infectivity model to explain ultrasensitivity Bray et al., 1998 Nature 393, 85 To explain the extreme sensitivity of E. coli to chemoattractants, Bray et al., propose that binding of ligand to a single receptor decreases the activation state of a group of adjacent receptors. The change in activation of the entire receptor complex is given by: DP = nAn1s where nA is the number of receptors bound, n1 is the number of adjacent receptors affected and s is the change in receptor activation state (p0 - p1) upon binding to ligand. The fractional saturation of receptors is nA/N = CA/(CA + Kd) The minimal concentration of A that is sufficient to cause a significant change in the receptor activation (DPmin) is then given by: CminA = Kd(nminA)/(N-nminA) = Kd(DPmin/n1s)/(N- DPmin/n1s) If n1 is larger than 1, then the concentration of ligand required to elicit a response is much lower. However the ability to higher concentrations is impaired.
Raindrop model of receptor saturation To expalin how this system can still respond at high concentrations of ligand, it is assumed that some receptors are not connected to the cluster and respond independently.
Chemoreceptors work in clusters in a cooperative manner to regulate CheY activity Wolnin & Stock (2004) Current Biology 14, R486
MWC model for chemoreceptor cooperativity Sourjik and Berg, 2004 Nature 428, 437
Rao, Frenklach and Arkin 2004 JMB 343, 291 Receptor trimer of dimers CheA Trimers of receptor dimers are the primary unit. Receptor methylation stabilizes the active form. Trimer-dimer aggregate into higher complexes via CheW and CheA. Cooperativity comes from neighboring interactions in the higher complex. The concentration of CheA and CheW determines cluster size and hence degree of cooperativity. CheW b) Cluster of trimer dimers held together by CheA and CheW
Rao, Frenklach and Arkin 2004 JMB 343, 291 Methylation state Assumptions: Receptor methylation increases the change in free energy from A to I (e.g. DG2110>DG0110) Ligand binding makes the free energy change from A to I more negative for any given methylation state. (e.g. DGm000>DGm111) For the homo Trimer-Dimer, all forms with a single ligand bound are treated identically in regard to ligand affinity K(A000-A001) = K (A000-A010) and treated identically for DG from state A to I (for simplicity, noted as DGm1). Analogous assumption for all 2 ligand states (designated DGm2). Ligand ocupation state of the three dimers Active States Inactive States Shaded receptors indicate ligand occupation. In addition to the equilibria shown, each Inactive trimer-dimer is in equilibrium with its analogous Active trimer-dimer of equivalent ligand occupation. Ligand binding shifts the equilibrium to the inactive state while methylation shifts to the active state
Effect of varying the A to I free energy change for 0, 1, 2 or 3 ligand occupation on the ligand-dependent activation state of the homo-Trimer-Dimer (for DG0, DG1 and DG2 variations, DG3 is fixed at -2.7 kcal/mol, insuring that the triply ligated form is inactive). Notice that increasing DG1 and DG2 lowers the apparent affinity and increases the cooperativity. Ligand concentration should be mM rather than mM
Fit of Dimer Trimer model to in vitro data for inactivation of purified Asp receptor by methyl-aspartate. (data from Bornhorst and Falke 2000, 2001; model from Rao, Frenklach and Arkin 2004 JMB 343, 291 97 mM Mimicking methylation by amino acid substitution of Asp receptors (1, 2, 3, or 4 substitutions) shifts the equilibrium in the absence of ligand toward the active state (DG0 goes from negative to slight positive. The apparent Kd for Asp shifts to a higher value and the Hill coefficient shifts to a slightly higher value (from 1.6 to 2.4). Figure b; A detailed fit of data from Bornhorst and Falke to the Dimer-Trimer model gives values for DG0, DG1, DG2, and DG3 consistent with expectations. All four DG values become less negative as methylation is increased. The model fits the data well. 16 mM
1 mM In vitro data for the Ser receptor requires a model with at least 6 receptors in a cluster (Dimer of Trimer-Dimers). Data from Li and Weiss, 2000. While DG0 changes only marginally with methylation (always between -2 and -1 Kcal/mol), the DG for intermediate levels of ligand occupation are very large negative numbers, indicating that in the absence of methylation, ligand binding to only 1 or 2 of the dimers in the cluster of 6 is enough to shift the entire cluster to the Inactive state, explaining ultrasensitivity at low levels of methylation. At high levels of methylation, DG is less negative for the intermediate states of ligand occupation and response to receptor occupation becomes dramatically less sensitive but much more sigmoidal. This is because at a methylation state of 4, DG0 through DG5 are small negative numbers but DG6 is still a large negative number. Thus, inactivation requires that all 6 sites be occupied (Hill coefficient near 6). 0.2 mM
Evidence that distinct chemotactic receptors interact to affect the cooperativity of CheA activation Sourjik and Berg, 2004 Nature 428, 437 Me-Asp Tar+, Tsr+ Tap+ Kinase Activity Ser Tar+, Tap+ Tar+ Me-Asp (mM) Tar expression (fold normal) In cells expressing only Tar, Me-Asp inhibition of CheA activity is sensitive and cooperative (Hill Coefficient of 3). Wild type levels of Tap expression (a minor receptor) reduces the sensitivity to Me-Asp. Wild type levels of both Tap and Tsr dramatically reduce the sensitivity to Me-Asp and also reduce the cooperativity (Hill coefficient of 1). Increasing the level of Tar expression with constant wild type levels of Tsr allows Me-Asp to completely inhibit CheA kinase activity. Rao, Frenklach and Arkin (2004) successfully fit these data with a mixed Trimer- Dimer model. Since Tsr can bind Me-Asp at very high concentrations, the model can also explain how cells respond to Me-Asp over nearly 6 orders of magnitude.
For cells expressing both Tar and Tsr, addition of a subsaturating amount of Ser (70 mM) increases the sensitivity to Me-Asp. Sourjik and Berg, 2004 Nature 428, 437 +Ser
Summary Ultrasensitivity is derived by cooperative behavior in phospho-CheY binding to its receptor at the motor, allowing a small change in P-CheY to produce a shift in direction of the motor. Ultrasensitivity is also derived from cooperative behavior in attractant binding to cell surface receptors. In addition, distinct chemoattractant receptors can interact to give synergistic responses between distinct ligands.
Degree of clustering depends on the ratio of Receptor, CheA and CheW Rao, Frenklach and Arkin 2004 JMB 343, 291 Receptor CheA CheW