Download
1 / 1
10 likes | 145 Vues
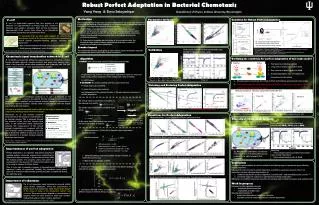
This study investigates the biochemical mechanisms underlying robust perfect adaptation in E. coli chemotaxis. By analyzing the reaction rate constants and the steady-state concentrations of key proteins such as CheYp, we reveal how the network achieves near-perfect adaptation independent of external stimuli. Using numerical methods, we explore parameter spaces crucial for adaptation and define the relationships between methylation and phosphorylation rates. Our findings contribute to the understanding of cellular signaling and may have broader implications for engineered systems exhibiting similar adaptation behaviors.

E N D
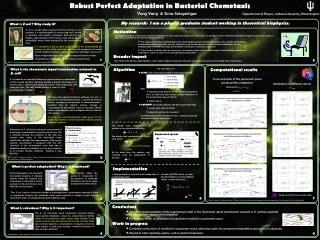
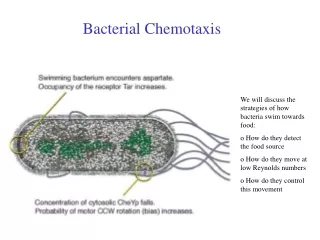
1% : state variables : reaction kinetics : reaction constants : external stimulus The steady state concentration of proteins in the network must satisfy: The steady state concentration of CheYp must satisfy: At the same time, the reaction rate constants must be independent of stimulus: • Chemical reactions: • Ligand binding • Methylation • Phosphorylation : allows for near-perfect adaptation = CheYp Robust Perfect Adaptation in Bacterial Chemotaxis Yang Yang & Sima Setayeshgar Department of Physics, Indiana University, Bloomington • Measurement of c = [CheY-P] by flagellar motor constrained by diffusive noise • Relative accuracy*, • Signaling pathway required to adapt “nearly” perfectly, to within this lower bound • (*) Berg & Purcell, Biophys. J. (1977). Verify steady state NR solutions dynamically using DSODE for different stimulus ramps: (1,15) • T2 • T3 • T4 • LT3 • LT4 • T2 • T3 • T4 • LT3 • LT4 • 3%<<5% • 1%<<3% • 0%<<1% T3 demethylation rate/ T2 methylation rate T4 demethylation rate/ T3 methylation rate (1,12.7) T3 Methylation rate (k2c) T3 demethylation rate/ T2 methylation rate LT4 demethylation rate/ LT3 methylation rate T2 Methylation rate (k1c) Parameter Surfaces Condition for Robust Perfect Adaptation k1c : 0.17 s-1 1 s-1 k8 : 15 s-1 12.7 s-1 T4 autophosphorylation rate (k10) T3 demethylation rate (km1) LT4 autophosphorylation rate (k10) Motivation CheB phosphorylation rate (kb) / literature value E .coli : diffusion constant (~ 3 µM) : linear dimension of motor C-ring (~ 45 nm) : CheY-P concentration (at steady state ~ 3 µM) : measurement time (run duration ~ 1 second) T3 autophosphorylation rate CheY phosphorylation rate (ky) / literature value 9% T4 autophosphorylation rate CheY1p (µM) Concentration(µM) LT3 autophosphorylation rate LT4 autophosphorylation rate E. coli is a single-celled organism that lives primary in our intestines. It is approximately 1-2 microns long and 1 micron in diameter, and weights 1 picogram. Each cell has 4-6 flagella, approximately 10-20 microns long, driven by an intracellular rotary motor operated by the protonmotive force. T2 autophosphorylation rate (k8) T3 autophosphorylation rate (k9) Spiro model. T2 autophosphorylation rate (k8) CheY phosphorylation rate CheB phosphorylation rate L=0(solid) L=1µM(dashed) L=1mM(dashed dot) T3 autophosphorylation rate (k9) The biochemical basis of robustness of perfect adaptation is not as yet fully understood. In this work, we develop a novel method for elucidating regions in parameter space of which the E. coli chemotaxis network adapts perfectly: Time(s) LT2 autophosphorylation rate LT2 autophosphorylation rate • The shapes of resulting manifolds determine relationships between reaction parameters (for example, methylation and phosphorylation rates) that must be satisfied in order for the network to exhibit perfect adaptation, thereby shedding light on biochemical steps and feedback mechanisms underlying robustness. • Given lack of complete data on values of in vivo reaction rates, the numerical ranges of the resulting manifolds will shed light on values of unknown or partially known parameters. (L)Tn autophosphorylation rate / literature value • {k3c= 5 s-1, k10 = 36 s-1, km2 = 3e+4 M-1s-1} • {k3c= 5 s-1, k10 = 101 s-1, km2 = 6.3e+4 M-1s-1} • It is considered to be an ideal model organism for understanding the behavior of cells at the molecular level from the perspectives of several scientific disciplines-anatomy, genetics, chemistry and physics since : • Ease of experimentation, through microscopy and genetic analysis • Small genome (4288 genes), most of which encode proteins k1c : 0.17 s-1 1 s-1 (L)Tn autophosphorylation rate / literature value CheY1 CheY2 T2 Methylation rate (k1c) Time (s) Barkai–Leibler model By varying 3 parameters(Ttot, k11, k3c) in the code to find a region where Ttot can vary a lot while the others remain constant. Broader impact L=0(solid) L=1µM(dashed) L=1mM(dashed dot) Ref: P. A. Spiro, J. S. Parkinson, and H. G. Othmer, “A model of excitation and adaptation in bacterial chemotaxis”, Proc. Natl. Acad. Sci. USA 94, 7263(1997) T.M.Yi, Y. Huang, M. I. Simon, and J. Doyle, “Robust perfect adaptation in bacterial chemotaxis through integral feedback control”,PNAS, 97, 4649 (2000) This method should have applicability to other cellular signal transduction networks and engineered systems that exhibit robust homeostasis. Ref: H. C. Berg, “Motile behavior of bacterial”, Physics Today, January 2000 Chemotaxis signal transduction network in E. coli Validation Verifying the conditions for perfect adaptation of two-state model Algorithm E. coli exhibits an important behavioral response known as chemotaxis - motion toward desirable chemicals (usually nutrients) and away from harmful ones - which is also shared by various other prokaryotic and eukaryotic cells. The cell’s motion consists of series of “runs” punctuated by “ tumbles”. T2 demethylation catalytic rate • STARTwith a fine-tuned model of chemotaxis network that: T1 demethylation catalytic rate Inactive active Fast ligand (un-)binding reaction Only acitive receptor can bind to CheB Only inactive receptor can bind to CheR Autophosphorylation rates of receptors are proportional to the activity T0 methylation catalytic rate T1 methylation catalytic rate • reproduces key features of experiments (adaptation times to small and large ramps, perfect adaptation of the steady state value of CheYp) • is NOT robust Phosphorylation transferrate form CheA to CheY and CheB are porportional to the activity The ratios between the CheR catalytic rate and CheB-p catalytic rate of the next methylation level are the same for all methylation states. • AUGMENT the model explicitly with the requirements that: T4 demethylation catalytic rate T3 demethylation catalytic rate • steady state value of CheYp • values of reaction rate constants, Verifying condition 6: reference value kb/kr=0.155/0.819=0.19 are independent of the external stimulus, s, thereby achieving robustness of perfect adaptation. T2 methylation catalytic rate T3 methylation catalytic rate Violating and Restoring Perfect Adaptation Slope=0.18 Slope=0.15 Slope=0.15 Slope=0.18 Slope=0.15 The chemotaxis signal transduction pathway in E. coli – a network of ~50 interacting proteins – converts an external stimulus (change in concentration of chemoattractant / repellent) into an internal stimulus (change in concentration of intracellular response regulator, CheYp) which in turn interacts with the flagella motor to bias the cell’s motion. It is used as a well-characterized model system for the study of properties of (two-component) cellular signaling networks in general. Slope=0.19 (1,12.7) Discretizing s into H points Ref: B. Mello, Y. Tu,”Perfect and near-perfect adaptation in a model of bacterial chemotaxis”, Biophysical Journal, 2003 Chemotaxis in E. coli involves temporal measurement of the change in concentration of an external stimulus. This is achieved through the existence of fast and slow reaction time scales, in the chemotaxis signal transduction network: fast measurement of the current external concentration is compared with the cell’s “memory” of the concentration some time ago to determine whether to extend a run in a given direction or to tumble, thereby randomly selecting a new direction. Conditions for Perfect Adaptation Diversity of Chemotaxis Systems There are n system variables, m system parameters and 1 small variable to allow near perfect adaptation, giving a total of (n+m+1)H equations and (n+m+1)H variables. Exact adaptation in modified chemotaxis network with CheY1, CheY2 and no CheZ: In different bacteria, additional protein components as well as multiple copies of certain chemotaxis proteins are present. Methylation Rate is proportional to AutophosphorylationRate Step stimulus from 0 to 1e-6M at t=250s 2 LT3 Methylation rate (k4c) LT2 Methylation rate (k3c) 2 LT4 demethylation rate (km4) T4 demethylation rate (km2) LT3 demethylation rate (km3) LT2 autophosphorylation rate (k12) LT3 autophosphorylation rate (k13) Ref: P. A. Spiro, J. S. Parkinson, and H. G. Othmer, “A model of excitation and adaptation in bacterial chemotaxis”, Proc. Natl. Acad. Sci. USA 94, 7263(1997) Demethylation Rate is proportional to Autophosphorylation Rate2 LT4 autophosphorylation rate (k13) T4 autophosphorylation rate (k10) LT3 autophosphorylation rate (k12) Response regulator Phosphate “sink” Importantance of perfect adaptation Perfect adaptation is an important and generic property of signaling systems, where the response (e.g. running bias in chemotaxis) returns precisely to the pre-stimulus level while the stimulus persists. This property allows the system to compensate for the presence of continued stimulation and to be ready to respond to further stimuli. • Requiring: • Faster phosphorylation/autodephosphorylation rates of CheY than CheY1 • Faster phosphorylation rate of CheB Eg.,Rhodobacter sphaeroides, Caulobacter crescentus and several rhizobacteriapossess multiple CheYs while lacking of CheZ homologue. Demethylation Rate/Methylation Rate is proportional toAutophosphorylationRate • Conclusions • Successful implementation of a novel method for elucidating regions in parameter space allowing precise adaptation • Numerical results for (near-) perfect adaptation manifolds in parameter space for the E. coli chemotaxis network, allowing determination of • conditions required for perfect adaptation, consistent with and extending previous works [1-3] • numerical ranges for unknown or partially known kinetic parameters • Extension to modified chemotaxis networks, for example with no CheZ homologue and multiple CheYs • Work in progress • Extension to other signaling networks: • vertebrate phototransduction • mammalian circadian clock • allowing determination of • parameter dependences underlying robustness • plausible numerical values for unknown network parameters Thus, E. coli is able to respond to changes in chemoattractant concentrations spanning 5 orders of magnitude! Similarly, the vertebrate visual system responds to changes in light intensity spanning 10 orders of magnitude during the night-day cycle. • Use Newton-Raphson (root finding algorithm with back-tracking), to solve for the steady state of augmented system, • Use Dsode (stiff ODE solver), to verify time- dependent behavior for different ranges of external stimulus by solving: CheB, CheYPhosphorylation Rate is proportional to AutophosphorylationRate Importance of robustness The E. coli chemotaxis signal transduction network exhibits robust perfect adaptation, where the concentration of CheYp returns to its prestimulus value despite large changes in the values of many of the biochemical reaction rate constants. These rate constants depend on concentrations of enzymes, which are often present in small copy numbers, making fluctuations in their numbers significant. Ref: N.Barkai & S. Leibler, “Robustness in simple biochemical network”, Nature 387, 913(1997)