Using BOY Data to Improve Student Outcomes
1.21k likes | 1.24k Vues
Learn how to analyze BOY data to identify strengths and weaknesses in your school and create an action plan for improvement.

Using BOY Data to Improve Student Outcomes
E N D
Presentation Transcript
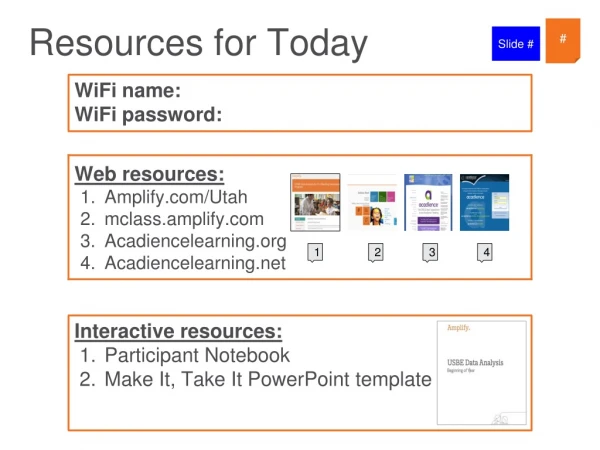
# Resources for Today Slide # WiFi name: WiFi password: 1 2 3 4 Interactive resources: • Participant Notebook • Make It, Take It PowerPoint template
BOY Data Analysis School and District Leaders Fall 2019
1 Agenda Welcome and Introduction Accessing Aggregate Reports Pathways of Progress Composite Score by Grade Level Break Measure Data by Grade Level Lunch Progress Monitoring Break Action Planning Wrap-up
Welcome and Introduction • Name • Location • Background/credentials • One fun fact • Insert picture of self in right box →
Norms • Participate actively • Take care of yourself • Manage your technology • Stay engaged • What is learned here, leaves here
Polling the Room Acadience Data Management – Acadiencelearning.net Amplify – mCLASS.amplify.com
1 Objectives By the end of the session you will be able to: • Explain how Acadience Reading data informs classroom instruction • Reflect on EOY Pathways by class and leverage reflections in order to support teachers and classrooms for this school year • Interpret aggregate BOY data reports to identify schoolwide priorities that align with LEA goals • Communicate the importance of progress monitoring with fidelity, including off-grade progress monitoring • Review MTSS framework and Literacy Framework, and identify and prioritize action steps for tiers of instruction • Identify celebrations, reflect on underlying causes, and generate a schoolwide action plan based on next steps in the data • Customize a “Make It, Take It” PowerPoint to lead data conversations back at your school
Agenda Welcome and Introduction Accessing Aggregate Reports Pathways of Progress Composite Score by Grade Level Break Measure Data by Grade Level Lunch Progress Monitoring Break Action Planning Wrap-up
Guiding Question How can you use your BOY data to identify strengths and weaknesses in your school to improve student outcomes?
Access mCLASS Web Reports mclass.amplify.com
Accessing Reports on Acadience Data Management Click on school and district reports
Agenda Welcome and Introduction Accessing Aggregate Reports Pathways of Progress Composite Score by Grade Level Break Measure Data by Grade Level Lunch Progress Monitoring Break Action Planning Wrap-up
State Requirement State Growth Goal: 60% of students in grades 1–3 achieve typical or better growth. This is the minimum goal. Achieving higher than 60% is encouraged!
Pathways of Progress Supports setting meaningful, ambitious, and attainable goals for all students Evaluates individual student progress and rate of growth Establishes individual student progress monitoring goals Evaluates the effectiveness of support at the classroom, school, or district level Compared to students with the same level of initial skills Not intended for teacher accountability Do not replace Benchmark goals.
Five Pathways Five research-based performance ranges Based on results from students across the United States Looks at students with identical BOY Composite Scores to determineEOY growth performance ranges EOY performance is categorized into five ranges that representthe “pathways of progress”
Understanding Pathways of Progress Growth comparisons are with students that begin at the same place Beginning of Year Composite Scores 80 70 90 150 130 120 110 100 140 Janie Alyssa Janie is compared with other children that begin with a composite of 90. Alyssa is compared with other children that begin with a composite of 130. Janie and Alyssa are not compared to each other.
Understanding Pathways of Progress Pathways are defined by distribution of scores at End of Year Distribution is cut into quintiles (20% in each group) to form the five different pathways. Janie and many other students form a cohort that begin the year with a composite score of 90. By End of Year, the cohort scores vary widely. 140 130 120 110 100 90 80 70 150 90
Understanding Pathways of Progress Pathways are defined by distribution of scores at End of Year 110 Janie and many other students form a cohort that begin the year with a composite score of 90. By End of Year, the cohort scores vary widely. 140 130 90 120 80 70 150 90 100 Well Above Typical Progress Above Typical Progress Typical Progress Below Typical Progress Well Below Typical Progress
Approach to Setting Goals The three guiding principles of setting goals with Pathways of Progress are that goals should be Ambitious, Attainable, and Meaningful. Throughout the goal setting process, teachers and instructional teams should be considering the resources and instructional changes needed to support student growth towards the goal. Ambitious They should challenge educators and students to make Above or Well Above Typical growth. Goals should never be set below or well below typical progress. Attainable They shouldn’t be so high they are unrealistic. They should not be SO attainable that they are no longer ambitious. Meaningful They should change student outcomes and increase the likelihood students will become successful readers.
Pathways of Progress: What can teachers see and do with Pathways?
Pathways of Progress: Teacher Perspective Teachers can: • Set goals for students after BOY benchmark assessment. • Monitor students’ progress towards pathway goal. • Review student pathway indicators after MOY benchmark assessment to see if your students are making sufficient progress toward goals. • Review the Pathway indicators after the EOY benchmark assessment to see students’ final pathway result. • Note: Even if teachers do not set a goal, students will have a pathway at MOY and EOY if they have a BOY composite score.
Pathways of Progress: Teacher Perspective in Acadience Data Management
Pathways of Progress: What growth data can leaders see?
1 Growth Reading Progress Indicators • Classrooms are ranked by percentage of students who made typical or better progress • Classrooms are compared to other classrooms across broad-based sample of students nationwide • Five categories used to describe classroom reading progress
Downloading Classroom Growth Report from mCLASS Home Click Download Your Data
Report in mCLASS mCLASS Classroom Growth Report
Report in Acadience Data Management Acadience Data ManagementSummative Growth Report
Downloading Summative Growth Report from Acadience Learning Select Summative Growth Report
2 Data Analysis – Looking Back to Look Forward Facilitator Model One teacher at a higher percentile ranking - she is a leader and more experienced Team has set goal that all classes will be above average in reading progress - see specific notes 3 Push for above average because of training over the summer and team support 1 Push for above average growth - received summer training and will receive intensive coaching support 1
3 UnderlyingCause Analysis • Instruction (All Tiers): Is core instruction being implemented with fidelity? Is intervention in place? • Scheduling and Time: Are all students that need intervention receiving it? Are students in the correct intervention? How much time is being spent in core/intervention? Does it match the recommendations of the Literacy Framework? • Staffing: Does the allocation of supplemental staff support the instructional needs of all students (both in core and intervention)? Are the most highly qualified teachers leading intervention groups? • Assessment Practices: Are assessment staff adequately trained to ensure accurate data collection? • Effective Data Review Practices: Have instructional staff reviewed current data and know where instruction needs to be for each student? • Professional Development: Has there been sufficient training on all resources (universal instruction/intervention)? Does instructional staff have a deep knowledge of early literacy skills and how to teach struggling students on the skills?
4 Questions to Consider: Model • Were there specific classrooms (grade levels) that made better than average reading progress? Which ones? Why do you think this is? • Were there specific classrooms (grade levels) that made less than average reading progress? Which ones? • How do you know what is happening in classrooms? Are you observing? • How will you use the information from this report to change your data story this year? Consider high-level factors such as: • Instruction • Evidenced-based materials • Scheduling and Time • Staffing • Assessment Practices • Effective Data Review Practices • Professional Development
Planning for Strategic Support • Review your data • Which teachers or grade-level teams do you want to provide additional support? How? • This is not punitive!
2, 4 Pathways Analysis Work Time 10 minutes Work Time
Agenda Welcome and Introduction Accessing Aggregate Reports Pathways of Progress Composite Score by Grade Level Break Measure Data by Grade Level Lunch Progress Monitoring Break Action Planning Wrap-up
BOY 19–20 Composite Score Data mCLASS Comparing Populations Acadience Learning Status Report
Data Analysis 60 70 70 70 67.5%
5 Composite Score Work Time - 10 minutes
3 UnderlyingCause Analysis • Instruction (All Tiers): Is core instruction being implemented with fidelity? Is intervention in place? • Scheduling and Time: Are all students that need intervention receiving it? Are students in the correct intervention? How much time is being spent in core/intervention? Does it match the recommendations of the Literacy Framework? • Staffing: Does the allocation of supplemental staff support the instructional needs of all students (both in core and intervention)? Are the most highly qualified teachers leading intervention groups? • Assessment Practices: Are assessment staff adequately trained to ensure accurate data collection? • Effective Data Review Practices: Have instructional staff reviewed current data and know where instruction needs to be for each student? • Professional Development: Has there been sufficient training on all resources (universal instruction/intervention)? Does instructional staff have a deep knowledge of early literacy skills and how to teach struggling students on the skills?
Facilitator Model Celebrate BOY at/above benchmark scores with grades 1–3 – each grade has 70% of students at/above benchmark. However, I want to make sure we get that to at least 80%. I am concerned that our kindergarten class has the fewest students at benchmark. When I look at the underlying causes, I think about scheduling and time. We need to be sure we are teaching to the literacy framework time schedules for K full day and half day. I want to meet with our K teachers on a weekly basis to discuss the Literacy framework to be sure time is explicitly to the key literacy skills is occurring and that teachers are using evidence-based curriculum for core and interventions.
5 Work Time – 7 minutes