Analyzing Spherical Data Clustering and Mean Orientation
Study and analyze clustered points on a sphere to determine mean orientation. Calculate resultant vector mean plunge and trend values. Conversion between plunge, trend, and direction cosines using mathematical equations.

Analyzing Spherical Data Clustering and Mean Orientation
E N D
Presentation Transcript
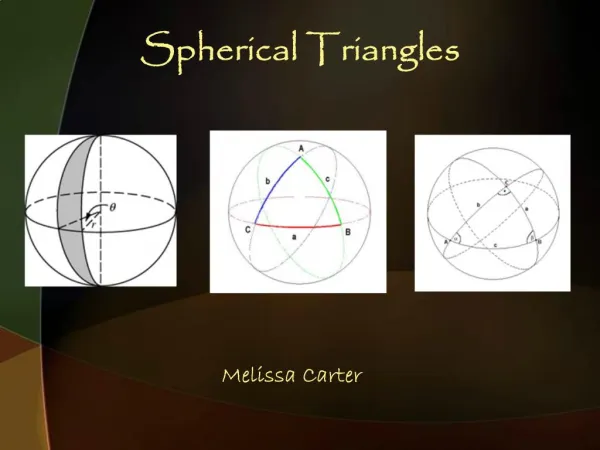
Spherical distributions Ragan Ch. 7
Analyze a cluster of points on a sphere. How do you determine the mean orientation and how clustered the data are? Mean direction is given by resultant vector
mean plunge = 40.0 mean trend = 208.6 R_bar is 0.96 [L, M, N] =plunge_trend_to_dir_cosines(p,t); Rx = sum(L); Ry = sum(M); Rz = sum(N); R_mag = sqrt(Rx.^2 + Ry.^2 + Rz.^2); l_bar = Rx./R_mag; m_bar = Ry./R_mag; n_bar = Rz./R_mag; [plunge, trend] = dir_cosines_to_plunge_trend(l_bar, m_bar, n_bar);
Ramon South Mountains joints mean plunge = 38.3 mean trend = 216.7 and R_bar is 0.45
Ramon South Mountains joints cleaned mean plunge = 26.9 mean trend = 216.7 and R_bar is 0.62