Download
1 / 26
260 likes | 447 Vues
GIS Analysis of Commercial Trucking Movements from a Canadian Perspective. GEOG 596A Peer Review Kristina Kwiatkowski Advisor : Justine Blanford. Presentation Outline. Background Information Movement Analysis Data Currently Methodology Objective Methodology

E N D
GIS Analysis of Commercial Trucking Movements from a Canadian Perspective GEOG 596A Peer Review Kristina Kwiatkowski Advisor: Justine Blanford
Presentation Outline • Background Information • Movement Analysis • Data • Currently Methodology • Objective • Methodology • Anticipated Project Outcome • Project Timeline
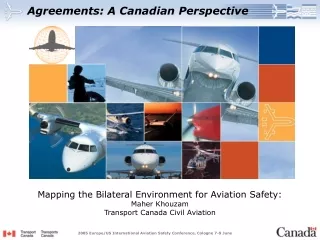
Canada - Trucking Overview Source: US Dept. of Transportation Source: Transport Canada
Canadian-American Border • over 8000km in length • in 2011, over 10 million two way trucking movements across the border • 57% of the value of Canada’s trade with the United States was exchanged using trucking in 2011
Trucking Overview Total Canada - U.S. Trade By Mode (% share of Annual Value Total) Percentage Share
Import and Export values between USA and Canada By Road Value
Analyzing truck movement is important • Movement of goods continue to increase • Safe movement of freight through the environment • Ensure reliable transport environments by maintaining infrastructure and reducing bottlenecks • Investment planning
Movement Analysis Not new, and used to • Identify key trucking corridors (Figliozzi et al., 2011) • Evaluate truck transit times between locations (McCormack, 2010) • Assess the feasibility of a statewide truck monitoring program (McCormack, 2010) • Predict wait-times at border-crossings in USA-Canada (Khan, 2010) • Analyze changes in cross-border trade movement between USA and Canada (Leoreet al., 2003) • Real-time planning of truck movement (Khan, 2010) • Determine infrastructure investment needs (Transport Canada, 2011)
Movement Analysis • Methods • Determine origin & destination of trip • Geofencing • Time-spent at a location • Determine purpose of trip • Analyzing stop-time at a location • Determining the routing of the trip • Analyzing truck volumes on highways • Identify problem routes (e.g. travel is slowed due to congestion/ poor infrastructure) Source: Guo et al 2012
Fluidity/Reliability of Movement To evaluate and identify factors that can affect trade movement, Transport Canada’s Gateways and Trade Corridors Initiative (TCGTCI) have developed a fluidity indicator that evaluates how trade corridors operate (Eisele et al., 2011). Based on “Time-to-Market” for different modes of transportation (e.g. marine, rail, roads and air) Transport Canada is able to determine fluidity of transport throughout Canada. A Fluidity Indicator is a quantitative value ranging from 0.1 (fluid/reliable) to 1.0 (not as reliable) that is used to • Measure of performance of Canadian Gateways • used to market and promote Canada’s efficiency • provide accountability and transparency in the supply chain • Support policymaking, program development and decision making
Calculating Fluidity of Movement To determine “time-to-market”: Origin and Destination, Travel speed, Distance Data
Truck Movement in North America One day of GPS data • March 1, 2013 • 30,770 distinct trucks • 2,965,989 GPS points No known source or destination Continual stream of information
Summary of Current Methodology for determining movement between locations • Major Canadian cities geofenced based on Census Metropolitan Area (CMA) boundary • CMA boundary table stored in SQL table • 96 unique city pairs with time and distance thresholds created and stored in SQL table • Algorithm queries the raw trucking GPS database and creates trips based on whether or not a truck was in a city of interest after being in a previous city of interest and then compares this with the threshold time and distance • Output of the algorithm is two .csv tables: a summary trip table with time and distance, and a table containing GPS points for each trip
Determining movement by distance and time using geofencing Actual Movement: Regina Calgary Winnipeg Algorithm Results: Regina Winnipeg Calgary Resulting Tables: Trip Detail Table Summary Table
Limitation of Current Methodology • Route taken by truck can be a variety of possible routes • Single trip will be broken into multiple trips as the truck passes through a geofenced area resulting in double counting • Origin and destination are determined by geofenced area therefore areas outside of this area will be incorrectly classified and not captured Saskatoon Calgary Regina Winnipeg
Objective The purpose of this study is to minimize misclassification of trips and improve upon the identification of source and destinations locations. • allow for improved routing analysis and • estimates of “time-to-market” between locations • so that it can be used with the fluidity indicator to obtain better assessments of reliability across the transport network (i.e. better identify problem routes and areas in need of investments)
Study – Data Due to large volume of GPS data collected, data for 1 month (N=35 million) will be used while refining and developing methods Study area will include cross-border movement (e.g. Emerson) • 3 trucks March 1-7 • No defined Origins or Destinations
Study – Understanding the data and trucking movement Frequency of GPS points captured (this is variable) Daily Movement • Does this vary by route • Is movement mainly during daylight hours • Is movement mainly during weekdays • Number of stops and length of stops taken.
Study – Determining Source and Destination Improving identification of source and destination • Several methods used different stop times (3 minutes to 10 minutes) Distances travelled • What distances are travelled associated with each trip? Routing Analysis • What are the key routes used? • Density analysis of GPS routes
Study – Determining border-wait times • border wait times are calculated by geofencing • known border cue areas were geofenced • dwell time is calculated by subtracting the time of the first point out of the fence from the point before entering the fence (Tardif, 2009)
Integration of methods to analyze routes Geofence to isolate trucks that cross the border & calculate border dwell time Join isolated Truck IDs to Database and pull their GPS points 72 hours before and after crossing Remove duplicates, format the date & time and calculate the time in between each GPS point per truck Validate Origin and Destination Flag the Origin and Destination in the database using defined stop time length Analyze routes driven using a density calculation
Anticipated Project Outcome • Determination of Origin and destination • Improve “time-to-market” inputs used in the Fluidity Indicator • Comprehensive assessment and validation of methods applicable for determining origin and destination • Automated methods • Efficient analysis of trucking movement • Ability to include new locations without being restricted to 96 paired locations • Trucking movement analysis: • Improved understanding of origins and destinations of cross-border truck movement • Identification of key routes taken by trucks both in Canada and the USA • Identification of problem areas along a route
Project Timeline November 2013: isolate and clean March 2013 data for the Emerson crossing. Identify trip origins and destinations, distances and transit & dwell times. December 2013: Validate origins and destinations. Perform Density analysis of routes. January 2014: Test the process on a larger crossing. Develop automated processes for trip calculations and analyses March 2014: Finalize project and write up
Selected References Andrienko, G., Andrienko, N., Bak, P., Keim, D., & Wrobel, S. (2013). Visual Analytics of Movement. Berlin, Heidelberg: Springer Berlin Heidelberg. doi:10.1007/978-3-642-37583-5 Axhausen, K. W., Schönfelder, S., Wolf, J., Oliveira, M., & Samaga, U. (2003). Eighty Weeks of GPS Traces : Approaches to Enriching Trip Information Submitted to the 83 rd Transportation Research Board Meeting Updated November 2003. Eisele, Wi., Tardif, L.-P., Villa, J. C., Schrank, D. L., & Lomax, T. (2011). Evaluating Global Freight Corridor Performance for Canada. Journal of Transportation of the Institute of Transportation Engineers, I(I), 39–58. Figliozzi, M. A., Wheeler, N., Albright, E., Walker, L., Sarkar, S., & Rice, D. (2011). Algorithms for Studying the Impact of Travel Time Reliability Along Multisegment Trucking Freight Corridors. Transportation Research Record, 2224, 26–34. doi:10.3141/2224-04 Guo, D., Zhu, X., Jin, H., Gao, P., & Andris, C. (2012). Discovering Spatial Patterns in Origin-Destination Mobility Data. Transactions in GIS, 16(3), 411–429. doi:10.1111/j.1467-9671.2012.01344.x Rinzivillo, S., Pedreschi, D., Nanni, M., Giannotti, F., Andrienko, N., & Andrienko, G. (2008). Visually driven analysis of movement data by progressive clustering. Information Visualization, 7(3-4), 225–239. doi:10.1057/palgrave.ivs.9500183 Schuessler, N., & Axhausen, K. W. (2008). Processing Raw Data from Global Positioning Systems Without Additional Information. Transportation Research Record: Journal of the Transportation Research Board, 2105, 28–36. doi:10.3141/2105-04 Tardif, L.-P. (2009). Application of Freight Flow Measurements. Vancouver: TRB/OECD Workshop. Retrieved from http://www.internationaltransportforum.org/Proceedings/reliability/P-Tardiff.pdf Transport Canada. (2011). Transportation in Canada 2011 (p. 149). Ottawa.
Acknowledgements Justine Blanford Louis-Paul Tardif Andrew Carter Alexander Gregory