Download
1 / 27
270 likes | 401 Vues
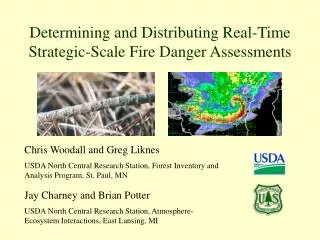
Determining and Distributing Real-Time Strategic-Scale Fire Danger Assessments. Chris Woodall and Greg Liknes USDA North Central Research Station, Forest Inventory and Analysis Program, St. Paul, MN. Jay Charney and Brian Potter

E N D
Determining and Distributing Real-Time Strategic-Scale Fire Danger Assessments Chris Woodall and Greg Liknes USDA North Central Research Station, Forest Inventory and Analysis Program, St. Paul, MN Jay Charney and Brian Potter USDA North Central Research Station, Atmosphere-Ecosystem Interactions, East Lansing, MI
Outline • Introduction • Fire Danger • Mapping Fuels • Simulating Weather • Objectives • Results • Simulations & Index • Wed-Based Dissemination • Conclusions
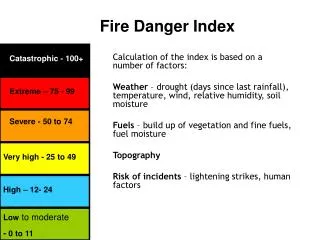
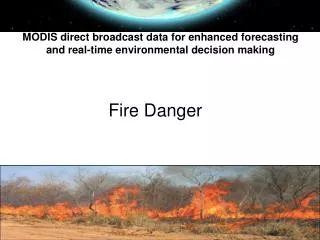
Fire Danger + Index Incorporating both Amount of Fuel and Condition of Fuel
High Fire Hazard + Low Fuel Moisture High Fuel Loading
Down Woody MaterialsForest Inventory and Analysis Program Strategic-Scale, Field Inventory-Based Estimate of Woody Fuels
Mesoscale Weather Data • The Eastern Area Modeling Consortium (EAMC) produces 48-hour fire-related weather predictions for all of Region 9: • Precipitation • Surface winds • Surface moisture • Temperature
Simulated Fuel Moisture Daily simulated precipitation totals from March 19th - April 1st, 2004 (cm and inches). Daily simulated fine fuel moisture from March 19th - April 1st 2004 (in % / 100).
Study Question??? Can index of fuel loadings and moisture be determined and distributed in real-time ?
Objectives • Link fuel loading and moisture estimates • Interpolate fuel inventory to meteorological grid • Estimate fuel moisture over series of time-steps • Create meaningful hazard index • Develop/suggest real-time distribution techniques
Down Woody Materials Data • Forest inventory plots of North Central States • XXX forested plots • 2001-2004 • Bailey’s (1995) Ecological Provinces 212, 222, 251 • 1-hr and 10-hr fuels
Burnable Fuels Index BFI = L (30-fm)/100 Where… L = 1- and 10-hr fuel loadings/acre fm = fine fuel moisture (%)
Burnable Fuels Index The BFI was a first attempt to combine weather models data, fuel moisture, and fuel loading information into a single index. The BFI has some utility in representing when dangerous fuel conditions are developing, but quantitative interpretation of the BFI is difficult at best, and misleading at worst. Before Event During Event After Event
Atmospheric Stability Index • We have developed a new way of coupling fuel information with a fire severity diagnostic. • We have used an atmospheric stability index that is used to predict thunderstorm severity. This index also indicates how fire plumes and, by association, the fires themselves, might behave under given atmospheric conditions. • Atmospheric stability indices are highly sensitive to moisture (water vapor) and temperature. • Fires produce large quantities of heat and water vapor. The amount of water vapor, in particular, depends on the fuel loading and fuel moisture. • We have combined an atmospheric stability index called the Convective Available Potential Energy (CAPE) with fuel moisture and FIA fuel loading information to produce a new fire severity index called the CFIA index.
The CFIA Index The CFIA index has the following formulation: CFIA = Where θe = Equivalent Potential Temperature (a variable that accounts for temperature (T) and moisture (q) effects on atmospheric stability) The CFIA accounts for the changes that a fire can cause in temperature and moisture (ΔT and Δq) above a fire and computes the impact of those changes on plume dynamics. The CFIA Index represents a step forward in that the impact of the fuel loading and fuel moisture is based on the physics of the atmosphere, rather than on an “engineered” equations (like the BFI).
Using the CFIA To use the CFIA index, fire managers or fire weather meteorologists would start with a map of the CAPE (unmodified). In this example, the CAPE is high across southern Minnesota and near Madison, WI.
Using the CFIA (continued) We can produce maps of the CAPE modified simply by the effects of fuel moisture over the region, without concern for fuel loading. This map shows higher CAPE (suggesting higher potential for extreme fire behavior) over broad areas in Minnesota, Wisconsin, and Iowa.
Using the CFIA (continued) CFIA Index By adding in information about the fuel loading, however, we can state where the potential for extreme fire behavior exists based on where there are fuels to burn. This technique produces a map that indicates geographic regions where fire risk is elevated for that time period. These maps can up updated hourly through the day, and predicted for 48-72 hours into the future.
Real-Time Distribution • Fuel Maps Static – Annually updated • Fuel Moisture Maps Dynamic – Updated Daily with maps that predict hourly changes. • Fire Hazard Maps Dynamically Updated on Web, every day.
Performance of the CFIA index has still not been tested for a variety of weather and fuel loading. The CFIA has not been validated against field observations of fire behavior Producing hourly maps of the CFIA is practical, but time-consuming, and would be simplified with a dedicated web server Dissemination Hurdles
Texas Example Fuel Map for Texas
Texas Example Simulated accumulated precipitation in mm The Southern High Resolution Modeling Consortium (SHRMC) in Athens, GA produces the same weather data as the EAMC for the southern United States. SHRMC weather data could be combined with FIA DWM data from the south to produce fire risk maps for that region.
Conclusions • Large-scale fuel inventory connected to meteorological data • Dynamic assessment of fire hazards • Incident management • Fire hazard dynamics