Download
1 / 17
170 likes | 309 Vues
ATTREX STM, October 20, 2014. TTL cooling and drying during the January 2013 Stratospheric Sudden Warming. Stephanie Evan; LACy / CNRS Karen Rosenlof; NOAA ESRL CSD Troy Thornberry ; CIRES, University of Colorado & NOAA ESRL CSD

E N D
ATTREX STM, October 20, 2014 TTL cooling and drying during the January 2013 Stratospheric Sudden Warming Stephanie Evan; LACy/CNRS Karen Rosenlof; NOAA ESRL CSD Troy Thornberry; CIRES, University of Colorado & NOAA ESRL CSD Andrew Rollins; CIRES, University of Colorado & NOAA ESRL Sergey Khaykin; LATMOS/CNRS Paper submitted to QJRMS
ATTREX STM, October 20, 2014 Contrasting 2013 with 2014, using gridded MLS water vapor at 82 mb. Note: 2006 is similar to 2013
ATTREX STM, October 20, 2014 Plumb&Bell 1982
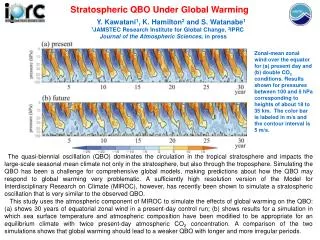
ATTREX STM, October 20, 2014 30 mb 65N-90N Temps 2012 2013 2014 70 mb 25S-25N Temps Data from NOAA CPC
ATTREX STM, October 20, 2014 The 2013 case was a strong event that apparently impacted zonally averaged water vapor, and, conveniently with aircraft data to back up the satellite observations of very low stratospheric water vapor. Stephanie’s paper looks at this event in detail: Examiningthe relation between tropical tropopause cooling, the SSW, and convective activity in the Western Pacific.
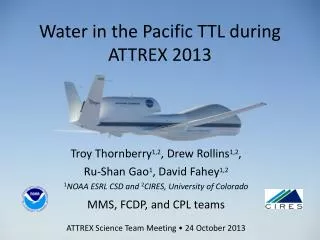
ATTREX STM, October 20, 2014 Verify that satellite measurements are reasonable Note: MLS 82 mb tropical zonal average for Jan 2005-2014 is 3.13 ppmv; value for 2013 is 2.56 ppmv Aircraft data: from NOAA_Water (Thornberry, Rollins, Gao) Balloon data: NOAA_FPH, launched from Hilo (Hurst)
ATTREX STM, October 20, 2014 During winter 2012/2013, conditions were similar to that in winter 2005/2006 Easterly shear (cold) phase of the QBO Major Sudden Stratospheric Warming Strong convection over the western Pacific SSW = rapid temperature increase in the polar vortex over a few days in winter; they are preceded by an increase in wave activity from the troposphere; these waves break in the stratosphere and strengthen the mean meridional circulation…downwelling with warming at high latitudes, upwelling with cooling in the tropics. Tropical link: Gomez-Escolar et al., 2014, JGR, show that enhanced tropical cooling in the lower stratosphere occurs preferentially during the QBO easterly sheer phase. Several studies have also shown that a SSW may enhance tropical convection (Kodera, Eguchi, Yoshida and Yamasaki) Change in wave activity -> changes mean meridional circulation and cools tropical lower stratosphere (as well as warming the polar stratosphere)-> change in TTL static stability -> possible impact on convection
ATTREX STM, October 20, 2014 Stephanie’s hypothesis: 2013 low water vapor values were a result of the combined effects of the SSW, changes in convection and the QBO Black line: MLS tropical average H2O at 82 mb Blue line: 2012/2013 winter Daily values plotted 2012/2013 starts out low (due to QBO) and has accelerated drying (due to SSW of Jan 6)
ATTREX STM, October 20, 2014 tropical 10 mb GPS T 60N Ubar polar 40-70N vertical EP Flux at 100 mb GPS CP T and Z Z T Day 0 = Jan 6, 2013
ATTREX STM, October 20, 2014 Time series of the tropical (15N-15S) wbarstar Enhancement of 150-70 mb upwelling due to subtropical wavebreaking.
ATTREX STM, October 20, 2014 Now a longitudinally resolved view: larger tropical temperature response in the western Pacific (panel c), greater increase in polar temperature from 60-180 degrees longitude. Red, 10 mb polar, black CPT tropics
ATTREX STM, October 20, 2014 Daily tropical OLR anomalies, blue=active convection, this strengthens at time of SSW, and at the longitude band of maximum polar warming.
ATTREX STM, October 20, 2014 OLR and MODIS cloud top pssr, before and after the SSW MJO phase diagram Southward shift of convective activity consistent with Kodera, Eguchi, and Yoshida and Yamazaki studes. Blue: Dec Green: Jan
ATTREX STM, October 20, 2014 Before SSW: enhanced mid latitude wave activity This increases strength of the mean meridional circulation Cools UTLS Changes static stability Changes height convection can reach
ATTREX STM, October 20, 2014 OLR (purple) N2 (black), 13-16 km (UT), 120-180 longitude region that has the with largest tropical temperature cooling.
ATTREX STM, October 20, 2014 Change in convection with the SSW Higher, colder cloud tops, leads to enhanced drying of air entering the stratosphere.