Download
1 / 10
100 likes | 136 Vues
Learn about exponential functions and how to graph them, with focus on domain and range identification. Understand exponential growth/decay, examples, and equations. Homework included.

E N D
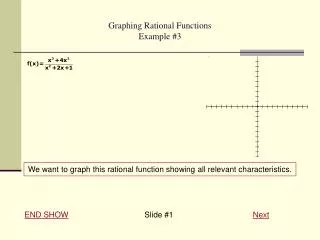
6.1– Graphing Exponential Functions Objective: TSW graph exponential functions and identify the domain and range of the function.
Exponential Functions • A function is called an exponential function if it has a constantgrowth/decay factor. • An exponential functions graph contains an asymptote – a line the graph approaches BUT never crosses over (a barrier in the graph)
Examples of Exponential Functions • Populations tend to growth exponentially not linearly. • When an object cools (e.g., a pot of soup on the dinner table), the temperature decreases exponentially toward the ambient temperature. • Radioactive substances decay exponentially. • Viruses and even rumors tend to spread exponentially through a population (at first).
Exponential Growth/Decay • If the factor b is greater than 1, then we call the relationshipexponential growth. • If the factor b is less than 1, we call the relationshipexponential decay. • The equation for an exponential relationship is given by • y = abx-h + k h = moves the graph left or right k = moves the graph up or down a = start amount If there is no “a” then a = 1 b = growth/decay factor b is ALWAYS the number with the exponent
To Graph an Exponential Function: • Identify the “k” value (this is your asymptote) - put a dotted line where your asymptote occurs. • Identify the “a” value and put your pencil on the y-axis (do not draw a point yet) • Use the “h” and “k” value to translate the graph from a. • Sketch the graph as either growth or decay. Exponential Growth Exponential Decay
Examples: Graph the following exponential functions. 1. y = 0.25(3)x 2. f(x) = 5(0.5)x
Examples: Graph the following exponential functions. 3. y = 0.75x 4. f(x) = 4x
Homework… pgs. 479-480 #’s 1-6(all), 8,13,15,16,18, 21-23(all)