Download
1 / 15
150 likes | 251 Vues
This study analyzes the vertical precipitation structures of hurricanes using TRMM radar data, focusing on eyewalls, inner, and outer rainbands. The findings reveal distinct patterns across storm quadrants. Ongoing work includes expanding the database to analyze factors influencing storm intensity.

E N D
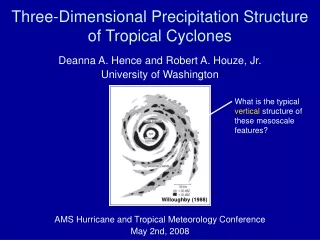
What is the typical vertical structure of these mesoscale features? Three-Dimensional Precipitation Structure of Tropical Cyclones Deanna A. Hence and Robert A. Houze, Jr. University of Washington AMS Hurricane and Tropical Meteorology Conference May 2nd, 2008 Willoughby (1988)
Idealized vertical structures suggested by past studies Inner rainband Inner rainband Deep Restricted Deep Outer rainband Outer rainband
Objectives of this study • Determine statistically the vertical structures of the mesoscale precipitation features of hurricanes • Determine how these structures vary from eyewall to inner rainband to outer rainband regions
TRMM Precipitation Radar (PR) • 13.8 GHz (2.17 cm) radar • 17º (from nadir) scanning angle • 215 km swath width • 4.3 km horizontal resolution • 250 m vertical resolution From NASA TRMM website (http://trmm.gsfc.nasa.gov/)
Annuli and Quadrant Analysis • Center location, eye diameter and storm motion provided in the National Hurricane Center (NHC) best track data
Primary Analysis Tools Relative frequency of occurrence • Contoured Frequency by Altitude Diagrams (CFADS, Yuter and Houze 1995) • NCAR Zebra software
Ordinary Deep Convection CFAD Convective component Stratiform component Total
Vertical Structure Analysis with CFADS • Analyze CFADs of all overpasses of hurricanes that reached Category 4 or 5. • Atlantic/Gulf of Mexico/Caribbean basin storms from 1998-2007 • Determine how structures of eyewall, rainbands, and outer bands vary with radius and storm quadrant
CFADS by Annulus-Outer Region • Resembles ordinary buoyant convection • Broad distribution of reflectivities below melting level • Bright band signature • Relatively broad distribution above melting level reaching to 11 km Outer Region Annulus 5
CFADS by Annulus -- Rainband Region • Strong brightband signature • Sharp dropoff of reflectivity above melting level reaching to just below 10 km • But… Narrower distribution of reflectivity below melting level…not like ordinary convection • Looks more like an eyewall CFAD Rainbands Annulus 3
CFADs by Annulus– Eyewall Region • Relatively narrow but intense distribution below melting level • Weak if any brightband signature • Mostly narrow & sharp distribution above melting level • Outliers suggest occasional intense convective towers reaching over 12 km • Not like convective or stratiform CFADs of ordinary convection Eyewall Annulus 1
Eyewall CFADs by Quadrant — All Overpasses LF Quad 1 RF Quad 4 Quad 1 Quad 4 Storm motion Quad 2 Quad 3 LR Quad 2 RR Quad 3
Rainbands CFADs by Quadrant — All Overpasses LF Quad 1 RF Quad 4 Storm motion LR Quad 2 RR Quad 3
Conclusions • Outer region CFADs • convective-like distribution • Rainband CFADs • Vertically limited • Narrow distribution • CFADs similar in all quadrants • Eyewall CFADs • Deep • Intense reflectivities • Relatively narrow distribution with extreme outliers • Right side stronger than left side
Ongoing and Future Work • Continue expansion of database to all Atlantic Basin hurricanes, and eventually to all basins • Stratify overpasses based on intensity, track speed, wind shear, sea surface temperature, and other factors known to influence storm structure and intensity • Perform EOF analysis to objectively sort CFADs • Use technique to analyze model simulations