AADF at the Murphy Gage (Hourly Method)
130 likes | 251 Vues
This report presents an analysis of the hourly methodology implemented at the Murphy Gage, demonstrating insights from the AADF data across 2011-2013. Conducted by David Hoekema for the Swan Falls Technical Working Group, the study highlights the revised methodology using 1-hour ∆storage and 10-minute averages of 120 measurements at CJ. Key findings reveal that AADF with hourly data is more stable than actual flow, with operations being identifiable while underscoring the need for further investigation at CJ due to duplicate inflow and uncertainty regarding daily fluctuations.

AADF at the Murphy Gage (Hourly Method)
E N D
Presentation Transcript
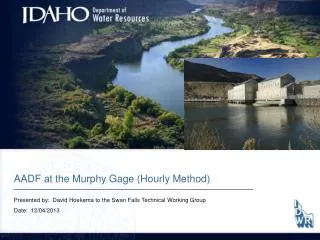
AADF at the Murphy Gage (Hourly Method) Presented by: David Hoekema to the Swan Falls Technical Working Group Date: 12/04/2013
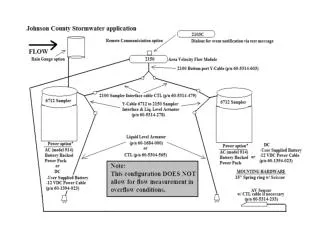
Conceptual Model
Analysis of WT-YR 2011-2013 • Revised Methodology • Using 1-hour ∆storage • Using 10 minute average of 120 measurements at CJ • Headwater data (smooth with 3-hour running average)
Summary from 2011-2013 Calculations • What was seen in the graphs? • AADF with hourly data is more stable than actual flow. • Operations are identifiable. • More investigation needed at CJ (duplicate inflow). • Investigation the uncertainty is needed. • How much daily fluctuation should we see?