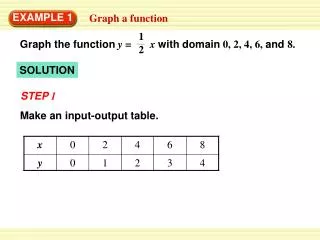

Graph a function represented by a table
E N D
Presentation Transcript
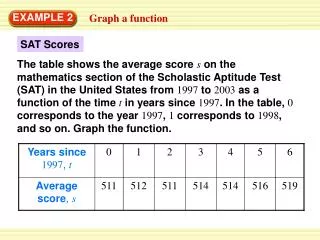
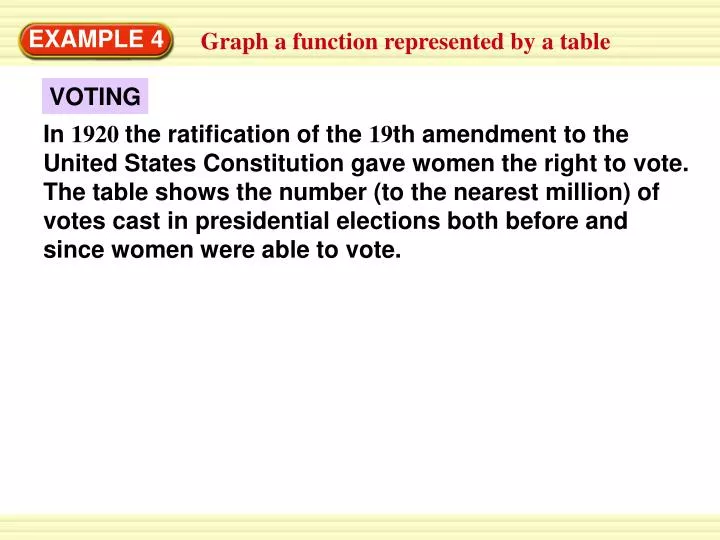
VOTING In1920 the ratification of the 19th amendment to the United States Constitution gave women the right to vote. The table shows the number (to the nearest million) of votes cast in presidential elections both before and since women were able to vote. EXAMPLE 4 Graph a function represented by a table
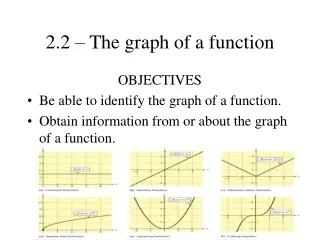
a. Explain how you know that the table represents a function. b. Graph the function represented by the table. c. Describe any trend in the number of votes cast. EXAMPLE 4 Graph a function represented by a table
SOLUTION a. The table represents a function because each input has exactly one output. b. To graph the function, let xbe the number of years before or since 1920. Let ybe the number of votes cast (in millions). The graph of the function is shown. EXAMPLE 4 Graph a function represented by a table
c. In the three election years before 1920, the number of votes cast was less than 20 million. In 1920, the number of votes cast was greater than 20 million. The number of votes cast continued to increase in the three election years since 1920. EXAMPLE 4 Graph a function represented by a table SOLUTION
for Example 4 GUIDED PRACTICE VOTING 8. The presidential election in 1972 was the first election in which 18-year-olds were allowed to vote. The table shows the number (to the nearest million) of votes cast in presidential elections both before and since 1972.
ANSWER The table represents a function because each input has exactly one output. for Example 4 GUIDED PRACTICE a.Explain how you know the graph represents a function.
ANSWER for Example 4 GUIDED PRACTICE b. Graph the function represented by the table.
ANSWER Sample answer: Before 1972, the number of votes cast increased by 2 million every 4 years. In 1972, the number increased by 5 millionandcontinued to increase by more than 2 million every four years since 1972. for Example 4 GUIDED PRACTICE c.Describe any trend in the number of votes cast.