The Human Population and Its Impact
370 likes | 561 Vues
The Human Population and Its Impact. Chapter 7. NATURAL CAPITAL DEGRADATION. Altering Nature to Meet Our Needs. Reduction of biodiversity. Increasing use of the earth's net primary productivity. Increasing genetic resistance of pest species and disease-causing bacteria.

The Human Population and Its Impact
E N D
Presentation Transcript
The Human Population and Its Impact Chapter 7
NATURAL CAPITAL DEGRADATION Altering Nature to Meet Our Needs Reduction of biodiversity Increasing use of the earth's net primary productivity Increasing genetic resistance of pest species and disease-causing bacteria Elimination of many natural predators Introduction of potentially harmful species into communities Using some renewable resources faster than they can be replenished Interfering with the earth's chemical cycling and energy flow processes Relying mostly on polluting and climate-changing fossil fuels
UN world population projections, assuming that by 2050 women will have an average of 2.5 children (high), 2.0 children (medium), or 1.5 children (low). The most likely projection is the medium one—9.3 billion by 2050. (Data from United Nations). Fig. 6-2, p. 125
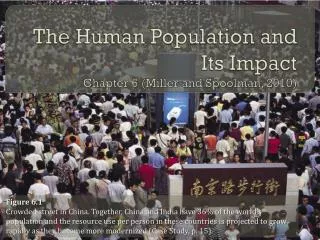
Core Case Study: Are There Too Many of Us? • How many people expected on the planet by 2050? • Are there too many people already? • Will technological advances overcome environmental resistance that populations face? • Should populations be controlled?
Core Case Study: Are There Too Many of Us? (2) • How will growing populations cause increased environmental stresses? • Infectious diseases • Biodiversity losses • Water shortages • Traffic congestion • Pollution of the seas • Climate change
The world’s 10 most populous countries in 2008, with projections of their population sizes in 2025 Fig. 6-3, p. 126
Human Population Growth Continues but It Is Unevenly Distributed • Population growth in developing countries is increasing 15 times faster than developed countries • By 2050, 97% of growth will be in developing countries • Should the optimum sustainable population be based on cultural carrying capacity?
What Factors Influence the Size of the Human Population? • Population Size: • Population size increases because of births and immigration and decreases through deaths and emigration. • TFR: • The average number of children born to women in a population (total fertility rate) is the key factor that determines population size.
The Human Population Can Grow, Decline, or Remain Fairly Stable • Population change • Births: fertility • Deaths: mortality • Migration • Population change = (births + immigration) – (deaths + emigration) • Crude birth rate • Crude death rate
Women Having Fewer Babies but Not Few Enough to Stabilize the World’s Population • Fertility rate • Replacement-level fertility rate • Total fertility rate (TFR)
Total fertility rates for the United States between 1917 and 2008. Question: The U.S. fertility rate has declined and remained at or below replacement levels since 1972, so why is the population of the United States still increasing? (Data from Population Reference Bureau and U.S. Census Bureau) Fig. 6-4, p. 127
32 30 28 26 24 22 Births per thousand population 20 18 End of World War II 16 Demographic transition Depression 14 Echo baby boom Baby boom Baby bust 0 1910 1920 1930 1940 1950 1960 1970 1980 1990 2000 2010 Year Birth rates in the United States, 1910–2008. Use this figure to trace changes in crude birth rates during your lifetime. (Data from U.S. Bureau of Census and U.S. Commerce Department) Fig. 6-5, p. 127
Case Study: The U.S. Population Is Growing Rapidly • Drop in TFR in U.S. • Rate of population growth has slowed • Population still growing and not leveling off • Fourfold increase since 1900 • Changes in lifestyle in the U.S. during the 20th century
Four stages of the demographic transition, which the population of a country can experience when it becomes industrialized. There is uncertainty about whether this model will apply to some of today’s developing countries. Question: At what stage is the country where you live?
Several Factors Affect Birth Rates and Fertility Rates (1) • Children as part of the labor force • Cost of raising and educating children • Availability of private and public pension • Urbanization • Educational and employment opportunities for women
Several Factors Affect Birth Rates and Fertility Rates (2) • Infant mortality rate • Average age of a woman at birth of first child • Availability of legal abortions • Availability of reliable birth control methods • Religious beliefs, traditions, and cultural norms
Several Factors Affect Death Rates (1) • Life expectancy • Infant mortality rate • Why are people living longer and fewer infants dying? • Increased food supply and distribution • Better nutrition • Medical advances • Improved sanitation
Several Factors Affect Death Rates (2) • U.S. infant mortality rate high due to • Inadequate health care for poor women during pregnancy and their infants • Drug addiction among pregnant women • High birth rate among teenagers
Some major changes that took place in the United States between 1900 and 2000. Question: Which two of these changes do you think were the most important? (Data from U.S. Census Bureau and Department of Commerce) Fig.6-6, p. 128
Migration Affects an Area’s Population Size • Economic improvement • Religious freedom • Political freedom • Wars • Environmental refugees
Male Female Male Female Male Female Male Female Expanding Rapidly Guatemala Nigeria Saudi Arabia Expanding Slowly United States Australia China Stable Japan Italy Greece Declining Germany Bulgaria Russia Postreproductive ages 45–85+ Prereproductive ages 0–14 Reproductive ages 15–44 Fig. 6-8, p. 131
Generalized population age structure diagrams for countries with rapid (1.5–3%), slow (0.3–1.4%), zero (0–0.2%), and negative (declining) population growth rates. A population with a large proportion of its people in the prereproductive age group (far left) has a large potential for rapid population growth. See an animation based on this figure at CengageNOW. Question: Which of these figures best represents the country where you live? (Data from Population Reference Bureau) Fig. 6-8, p. 131
Some Problems with Rapid Population Decline Can threaten economic growth Labor shortages Less government revenues with fewer workers Less entrepreneurship and new business formation Less likelihood for new technology development Increasing public deficits to fund higher pension and health-care costs Pensions may be cut and retirement age increased Fig. 6-11, p. 133
Tracking the baby-boom generation in the United States. U.S. population by age and sex, 1955, 1985, 2015, and 2035 (projected). (Data from U.S. Census Bureau) Fig. 6-10, p. 132
Populations Can Decline from a Rising Death Rate: The AIDS Tragedy • 25 million killed by 2008 • Many young adults die: loss of most productive workers • Sharp drop in life expectancy • International community called upon to • Reduce the spread of HIV through education and health care • Financial assistance and volunteers
How Can We Slow Human Population Growth? • Most effective ways to slow human population growth are to • 1)encourage family planning • 2) to reduce poverty • 3) elevate the status of women.
Women from a village in the West African country of Burkina Faso returning with fuelwood. Typically they spend 2 hours a day two or three times a week searching for and hauling fuelwood. Fig. 6-13, p. 135
Planning for Babies Works • Family Planning • Responsible for a 55% drop in TFRs • In developing countries • Expansion of program • Include teenagers, sexually active unmarried women, and men • Slow and stabilize population growth • Invest in family planning • Reduce poverty • Elevate the social and economic status of women
Empowering Women Can Slow Population Growth • Education • Paying jobs • Human rights without suppression
Case Study: Slowing Population Growth in China: the One-Child Policy • Encourages fewer children • Gender imbalance • Fast-growing economy • Face serious resource and environmental problems
Case Study: Slowing Population Growth in India • Population control: gender bias • Poverty • Malnutrition • Environmental problems • What types of incentives does India provide as strategies to reduce the population growth?