Download

1 / 71
720 likes | 984 Vues
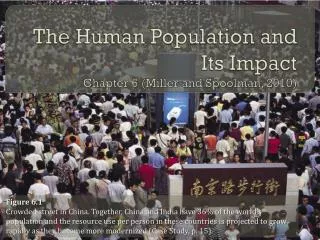
The Human Population and Its Impact. Chapter 6. Reasons for human population increase:. Movement into new habitats and climate zones Early and modern agriculture methods Control of infectious diseases through -Sanitation systems -Antibiotics -Vaccines. :. Death Rate.

E N D
The Human Population and Its Impact Chapter 6
Reasons for human population increase: Movement into new habitats and climate zones Early and modern agriculture methods Control of infectious diseases through -Sanitation systems -Antibiotics -Vaccines : Death Rate
10,000 yrs ago- 5 million1930- 2 billion1975 – 4 billion2011 – 7 billion2050 – 9.5 billion
UN World Population Projections by 2050 2.5 children 2.0 children World population is growing exponentially at a rate of 1.21% 1.5 children The prospect of stabilization in the near future is nil. We are moving from a J-Curve to an S-curve
What does a 1.21% growth rate mean? • There were about 83 million people added to the earth in 2010 • Which is about 227,000 people every day • Which is 2 more people every time your heart beats
Population growth in developing countries is increasing 15 times faster than developed countries By 2050, 97% of growth will be in developing countriesShould the optimum sustainable population be based on cultural carrying capacity?Optimum level that allows people to live in reasonable comfort and freedom and still have sustainability
How Long Can the Human Population Keep Growing? • Thomas Malthus and population growth: 1798 (Populations increase exponentially , food supply increases linearly. Wrong!! Actually-food-exponentially due to genetic and technological advances) • Humans have altered 83% of the earth’s land surface • Can the human population grow indefinitely?
What is really the problem? • Overpopulation? This is degrading our planet. (82% of population is in less developed nations) • Overconsumption? Americans ecological footprints are 4.5X larger than the average Chinese and 9.5 times larger than the average Indian • Technology? These advances have helped eliminate environmental resistances • How do we alter nature?
The Human Population Can Grow, Decline, or Remain Fairly Stable • Population change • Births: fertility • Deaths: mortality • Migration • Population change = (births + immigration) – (deaths + emigration) • Crude birth rate=# of live births per 1000 people in a population • Crude death rate=# of deaths per 1000 people in a population
Women Having Fewer Babies but Not Few Enough to Stabilize the World’s Population • Fertility rate- # of children born to a woman during her lifetime • Replacement-level fertility rate- avg. # of kids that a couple must bear to replace themselves. • 2.1 developed-2.5 in developing Total fertility rate (TFR)- avg. # of kids born to a woman during reproductive years. TFR in 2010: 1.7 per woman in developed countries 2.7 per woman in developing countries
In 2010, TFR in developing countries dropped from 6.2 to 2.7 and in developed countries, from 2.8 to 1.7 • In China, the TFR dropped from 5.7 to 1.5 (from 1972-2010)
Birth Rates in the U.S. from 1910 to 2008baby boom TFR= 3.72010 TFR= 2.1
Some Major Changes That Took Place in the U.S. between 1900 and 2000
Several Factors Affect Birth Rates and Fertility Rates $220,000 • Children as part of the labor force • Cost of raising and educating children Fact: : It costs to raise a child in the US from birth to 18. • Availability of private and public pension • Urbanization • Educational and employment opportunities for women-TFR is low as education
Several Factors Affect Birth Rates and Fertility Rates • Average age at marriage (the older they are when they marry, the fewer children they usually have) • Religious beliefs, traditions and cultural norms
Reducing Births PROS • better than raising death rate • we already fail to provide basic necessities for one-fifth of the world • over pop. Is the main reason for environmental degradation and resource over consumption • technology is the key to economic power, not more people • freedom to reproduce should only apply if it does not reduce the quality of other peoples lives CONS *people live longer *some people believe that the world can support millions more *people are our most valuable resource
Several Factors Affect Death Rates • Infant mortality rate • Average age of a woman at birth of first child • Availability of legal abortions • Availability of reliable birth control methods • Religious beliefs, traditions, and cultural norms Population increase is due to decline in crude death rate
Migration Affects an Area’s Population Size Why migrate??? • Economic improvement • Religious freedom • Political freedom • Wars • Environmental refugees-40 million in 2008, water and food shortage, drought
Several Factors Affect Death Rates • Life expectancy- globally, increased from 47 to 69 years from 1955-2010. by 2050…74 years • Japan has longest life expectancy of 83 and US is 78 (50th of all nations) • Infant mortality rate- reflects country’s level of nutrition and health care • Why are people living longer and fewer infants dying? • Increased food supply and distribution • Better nutrition • Medical advances • Improved sanitation
U.S. infant mortality rate high due to • Inadequate health care for poor women during pregnancy and their infants • Drug addiction among pregnant women • High birth rate among teenagers
Legal Immigration to the U.S. between 1820 and 2003 • Immigration Reform and Control Act of 1986: granted legal status to illegal immigrants if they showed they lived in the country several years.
36% of US growth is due to legal/illegal immigration • Many Americans believe all immigration should be reduced.
Opposition- • It would diminish the historical role of the US being a place of opportunity for the poor and oppressed • Take away cultural diversity • Most immigrants pay taxes, start new businesses and create jobs • Take menial and low paying jobs • Proponents- • Allow immigrants if they can support themselves • By lowering immigration, the US could stabilize its population and reduce its ecological footprint
Populations Made Up Mostly of Young People Can Grow Rapidly • Age structure categories • Pre-reproductive ages (0-14) • Reproductive ages (15-44) • Post-reproductive ages (45-over) Males vs. females
Generalized Population Age Structure Diagrams Nearly 27% of people on planet were under 15 in 2010
Population Structure by Age and Sex in Developing and Developed Countries
We Can Use Age-Structure Information to Make Population and Economic Projections • Baby boomers • Job market when they retire-job shortage
The Fastest Growing Age Group Is… SENIORS! • The global populations of seniors is projected to triple by 2050 in which 1 of every 6 people will be 65 or older. • This graying of the population is due to declining birth rates and longer life expectancies due to medical advancements.
Populations Made Up of Mostly Older People Can Decline Rapidly • Slow decline • Manageable • Rapid decline-Japan, Russia, Germany, Hungary, Greece, Italy • Severe economic problems (less in work force, fewer children to care for grandparents, more spent on medical care, pension funds, and shortages of health-care workers
40 1945 41.9 workers 30 20 Number of workers supporting each Social Security beneficiary 1950 16.5 10 2075 1.9 0 2000 2050 2075 1945 Fig. 11.20, p. 249
Populations Can Decline from a Rising Death Rate: The AIDS Tragedy 27 million killed by 2009 Many young adults die: loss of most productive workers Sharp drop in life expectancy International community called upon to • Reduce the spread of HIV through education and health care • Financial assistance and volunteers to provide education, healthcare, teachers, social workers
Slowing the Human Population Growth • Demographic Transition: As countries become industrialized • Death rate declines • Then birth rate declines • 4 majors stages…
US is in the early phase of stage 4 • Most of the less developed countries will make a demographic transition over the next few decades due to technology and family planning • Some fear these countries will stay in stage 2 due to extreme poverty, and rapid population growth. Many lack basic services such as food, health care and education. Countries are in civil war, and are training grounds for terrorist groups • Somalia- 3% population growth, TFR=6.5 and 45% of population under 15. • Haiti- foreign debt, lack of skilled workers, large number of people in poverty, and the 7.0 earthquake in Jan 2010
Planning for Babies Works • Family Planning • Responsible for a 55% drop in TFRs • In developing countries • Expansion of program • Include teenagers, sexually active unmarried women, and men • Slow and stabilize population growth • Invest in family planning • Reduce poverty • Elevate the social and economic status of women
Bangladesh- TFR dropped from 6.0 in 1960 to 2.7 in 2010. • Family planning and economic development are responsible for the drop. • Thailand’s TFR dropped from 6.4 to 1.8 • The best way to slow and stabilize population growth are through 1. promoting economic development 2. elevating the social and economic status of women 3. Encouraging family planning
Empowering Women Can Slow Population Growth • Education-fewer children • Paying jobs • Human rights without suppression • “For poor women the only holiday is when you are asleep” Women account for 2/3 of all hours worked, but only get 10% of world's income
8:30 P.M.- 9:30 P.M. Wash dishes and children 5:30 P.M.- 3:00 P.M. Work in fields 3:00 P.M.- 4:00 P.M. Collect firewood 6:30 P.M.- 8:30 P.M. Cook for family and eat 9:30 P.M. Go to bed 4:45 A.M. Wake, wash, and eat 5:00 A.M.- 5:30 A.M. Walk to fields 4:00 P.M.- 5:30 P.M. Pound and grind corn 5:30 P.M.- 6:30 P.M. Collect water Fig. 11.28, p. 256
Women • Make up 70% of the world’s poor • 64% are illiterate (and 5-7 children) • 60-80% of work associated with growing food, gathering wood and hauling wood and water • In most societies, they have fewer rights and educational and economic opportunities • (Sharbat Gula 1985 and 2002) • (Afghanistan refugee who crossed over into Pakistan)
Slowing growth in India • 1952- the first national family planning program began • 2nd largest population today, but projected to be the largest by 2015 • 32% of its population is under 15 • 4th largest economy, growing middle class • Faces poverty, malnutrition and environmental problems • ¼ of urban population lives in slums • 2/3 of population lives in rural areas • Nearly ½ are unemployed or underemployed • ¾ live on less than $2.25 a day
Most poor couples believe they need several children to work and care for them in old age • Cultural preference for male children • Only 48% use some form of birth control • 17% of world’s population, 2.3% of land and 2% of forests • Soil erosion and overgrazing of ½ of croplands • 2/3 water is polluted • Sanitation often inadequate • Economic growth= larger ecologic footprint but possible a slower population growth
What does it mean to grow exponentially? • Youtube. The most important video you’ll ever see
Population Calculations Global population growth rate = CBR-CDR 10 If there were 20 people born per 1,000 people and 8 deaths per 1,000, the global population growth rate would be 1.2% 20-8 10 In 2011, the population growth rate of the …. world was 1.09% Zimbabwe = 4.3% Japan = -0.1% US = 0.9% China= 0.5% India = 1.3%