Human Population, Population Dynamics & Environmental Impact
110 likes | 373 Vues
Human Population, Population Dynamics & Environmental Impact. Unit 3. Human Populations. World population clock Population graph It is predicted that the human population will reach almost 9.5 billion people by 2050

Human Population, Population Dynamics & Environmental Impact
E N D
Presentation Transcript
Human Population,Population Dynamics&Environmental Impact Unit 3
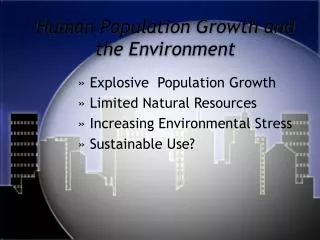
Human Populations • World population clock • Population graph • It is predicted that the human population will reach almost 9.5 billion people by 2050 • Do you think we will have reached our carrying capacity by then? Is the human race getting ready for a population crash? • What determines the human population impact on the environment?
Human Population A little History: 1. Hunters/gatherers. • Small communities that could support themselves. • Usually moved around following the herds. 2. Rise of agriculture. • People started to farm, grow crops to feed themselves and others • Somewhat settled communities and villages, controlled by the seasons. • Larger families to support the labor needs of the crops. • Major increase in the human population. 3. Industrial revolution. • Improvements to food supply, health care, living conditions • More city dwellings, to keep workers closer to the factory. • Rapid increase in human population. 4. Technology age (today) • Rate of population has steadied or decreased in wealthy countries, ie US, Canada, Europe • Increase in city populations. • High health care, food supply/nutrition, increased living conditions. • Education and world awareness have increased.
Reproductive strategies K-selected: • Characterized by larger sized organisms that live at or near the carrying capacity for their species. • Few offspring, with higher survival rate • Spend larger amounts of energy on parental care where most offspring survive. • Characteristics of k-selected species: • Long life span with slower maturity rate, maturing at a late age. • High parental care and protection • Adapted to stable environment • Lives in later succession stages • Niche specialists • Predators • Regulated by internal factors • Higher trophic level • Ex: humans, trees, elephants
Reproductive Strategies R-Selected: • Characterized by smaller sized organisms with high populations exceeding carrying capacity and end up crashing the population (j-curve). • Rapid reproduction rate, shorter life span • Spends larger amounts of energy on producing offspring, but not in parental care and protection. • Characteristics of r-selected species: • Many offspring with rapid growth and early maturity. • Adapted to unstable environment • Pioneers and colonizers, early succession stages • Niche generalists • Prey • Regulated by mainly external factors • Lower trophic levels • Ex: fish, annual plants, bacteria
Human Population Impact on the environment: • Increase in resource use • Especially non-renewable resources like coal, oil, natural gas. • Produces more wastes • Solid wastes, garbage island in ocean, sewage and water wastes. • Pollutes the environment • Places to put the wastes as area of nonliving people decreases (habitat loss) • Less space for other species to survive if there are larger cities and more people.
Malthus The Malthus Hypothesis: Thomas Malthus – • lived 1766-1834 • expressed a pessimistic view on the dangers of overpopulation growth. • He claimed that food supply was the main limiting factor that could contribute • to pop growth. • pop growth grew exponentially (2,4,8,16…) while food supply grew • arithmetically (2,4,6,8…). • Law of diminishing returns – over cultivation of land Limitations: • too simplistic a theory • a shortage of food is just one possible explanation, when only the poor go • hungry • unequal distribution of resources is greater cause • Increase in Technology is far greater than Malthus predicted.
Boserup Ester Boserup’s Theory: Ester Boserup – 1965 • A Danish economist – “necessity if the mother of invention” • Asserted that any increase in a population will demand an increase in food supply therefore the technology to create more food will become available. • Based on her research in various land use systems • Innovation and shifting in cultivation methods will increase the production of food. Limitations: • Based on a “closed” community, but immigration and emigration are too common. • Too difficult to test due to immigration and emigration because of overpopulation in certain areas.
Survivorship Curves How to predict the survivorship fate of a group of individuals by knowing at what age individuals died. Can represent the mortality patterns of a population over a period of time. Where the patterns stay relatively consistent for each species.
Graph 1 – typical K-select Rare R-select