9.1: Sampling Distributions
9.1: Sampling Distributions. Parameter vs. Statistic. Remember! PPSS! P opulation – P arameter S ample – S tatistic. Parameter : a number that describes the population A parameter is an actual number, but we don’t know what it is because we cannot reach/interview the entire population.

9.1: Sampling Distributions
E N D
Presentation Transcript
Parameter vs. Statistic Remember! PPSS! Population – Parameter Sample – Statistic • Parameter: a number that describes the population • A parameter is an actual number, but we don’t know what it is because we cannot reach/interview the entire population. • Statistic: a number that describes a sample • The value of a statistic can change from sample to sample. • A statistic is used to estimate an unknown parameter.
Ex 1: Making Money • The mean income of the sample of households contacted by the Current Population Survey was x = $60,528. • What is the statistic? • $60,528, because it describes this one Current Population Survey Sample • What is the parameter? • The mean income of 113 million U.S. households.
Population vs. Sample • Use μ for the population mean. • Use x for the sample mean. • The sample mean x is an estimate of the actual mean μ of the population. • The fact that the value of a statistic varies in repeated random sampling is called sampling variability.
Ex 2: Do you believe in ghosts? • The Gallup Poll asked a random sample of 515 U.S. adults whether they believe in ghosts. Of the respondents, 160 said “Yes.” • What is the proportion of the sample who say they believe in ghosts?
In this example, what is the statistic? 0.31 • What is the parameter? The proportion of all U.S. adults who believe in ghosts. Could we conclude that the proportion of all U.S. adults who believe in ghosts is 0.31? No! A different sample would probably yield a different .
Sampling Variability and Distribution • Take a large number of samples from the same population. • Calculate the sample mean x or sample proportion for each sample. • Make a histogram of the values of x or . • Examine the distribution displayed in a histogram for shape, center, and spread, as well as outliers or other deviations.
Ex 3: Baggage Check! • Instead of systematically searching passengers, Customs agents at Guadalajara airport have passengers push a button that is connected to a modified stoplight. • If the stoplight turns green, passengers may proceed to their flight. If the stoplight turns red, the passenger is searched. • The stoplight is programmed to turn green with a probability of 0.70.
Let the number 1 – 7 represent passengers who get the green light. Number 8 – 10 represent passengers who get the red light. • Use your calculator to generate 100 random numbers into L1. (Randint(1,10,100)) • Sort L1 in ascending order. • Compute the proportion of “green lights”.
Sampling Distribution • The sampling distribution of a statistic is the distribution of values taken by the statistic in all possible samples of the same size from the same population. This is an ideal definition in that it would be difficult to actually consider all the possible samples of a large population.
Ex 4: Are you a Survivor fan? • According to 2005 Nielson ratings, Survivor: Guatemala was one of the most-watched television shows during every week that it aired. • Suppose that the true proportion of U.S. adults who watched Survivor: Guatemala is p = 0.37.
Distribution of 1000 SRSs of size n = 100 from the population. Describe the SOCS!
The overall shape of the distribution is roughly symmetric and approximately normal. • The center of the distribution is very close to the true value p = 0.37. • The values of have a large spread. They range from 0.22 to 0.535. • There are no outliers.
Approximate sampling distributions for two different sample sizes from a population with p = 0.37 Both statistics are unbiased because the means of their distributions equal the true population value p = 0.37. Sample Size 1000 Sample Size 100
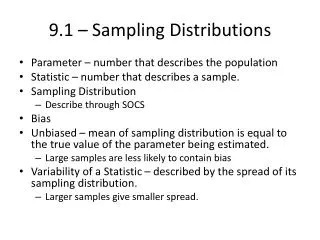
Unbiased Statistic • A statistic used to estimate a parameter is unbiased if the mean of its sampling distribution is equal to the true value of the parameter being estimated. • Note that an individual statistic does not need to have the exact same mean as the population to be unbiased. • The idea is that over many SRSs, the mean of the sampling distribution will approach the mean of the actual population.
The Variability of a Statistic • The sample proportion from a random sample of any size is an unbiased estimate of the population parameter. • Larger samples are more likely to produce an estimate close to the true value of the parameter because there is much less variability among large samples than among small samples.
Ex 5: Sample Size and Variability • Using an SRS size of 100 yields a distribution with mean 0.37 and standard deviation 0.05. • Using the empirical rule, 95% of the values of will fall between which two values? 27% and 47% • Using an SRS size of 1000 yields a distribution with mean 0.37 and standard deviation 0.01. • Using the empirical rule, 95% of the values of will fall between which two values? 35% and 39% Which sample size has less variability?
Variability of a Statistic • The variability of a statistic is described by the spread of its sampling distribution. This spread is determined by the sampling design and the size of the sample. Larger samples give smaller spread. • As long as the population is much larger than the sample, the spread of a sampling distribution will depend only on sample size and not on the size of the population.