Download
1 / 16
160 likes | 179 Vues
This study examines the changes in nutrient levels, chlorophyll concentrations, phytoplankton composition, and primary production in the Chukchi Sea. The results show a decrease in primary production rates and biomass, suggesting a decrease in nutrient availability due to faster growth of large phytoplankton and grazing by zooplankton.

E N D
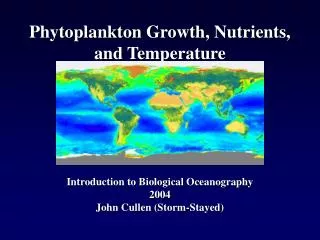
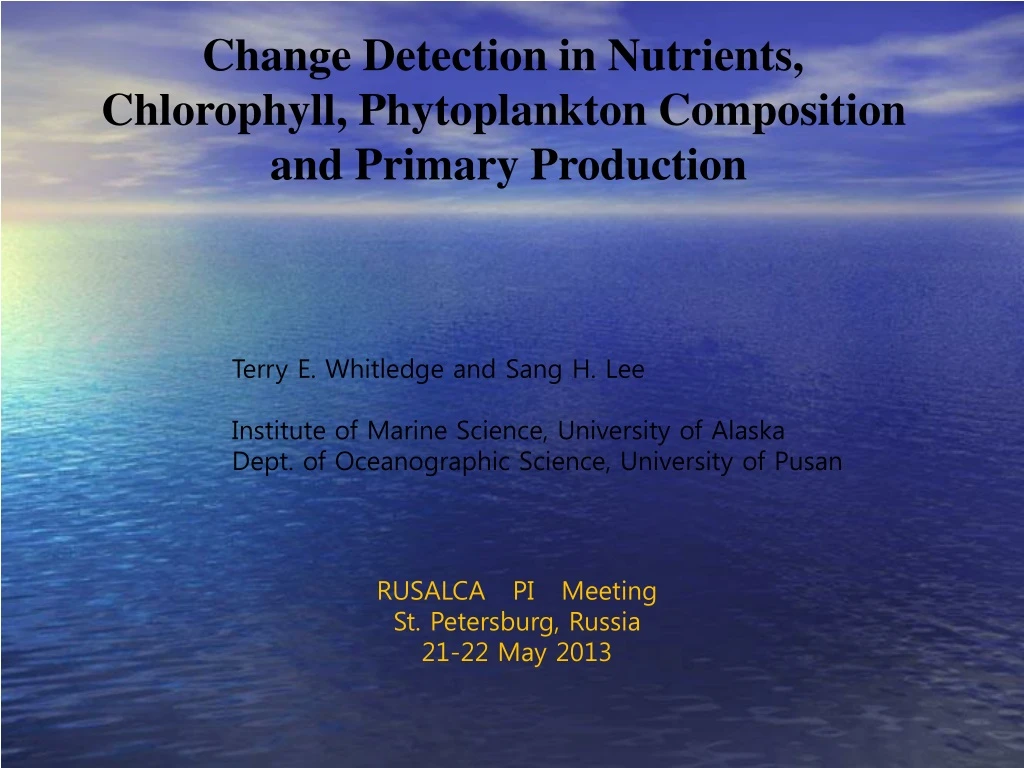
Change Detection in Nutrients, Chlorophyll, Phytoplankton Composition and Primary Production Terry E. Whitledge and Sang H. Lee Institute of Marine Science, University of Alaska Dept. of Oceanographic Science, University of Pusan RUSALCA PI Meeting St. Petersburg, Russia 21-22 May 2013
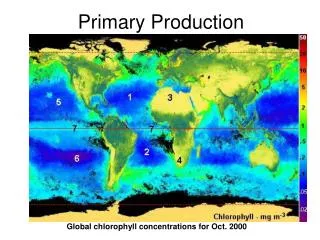
Primary Production Stations on Leg 2 GD7 HC49 WN3 HC24 WN1 SS4 HC60 SS5 LS3 CEN4 LS1 CL3 CL1 CL6 CL7A CS12 CS16 CS4 CS8 CS1
A>20 µm 5 µm <B<20 µm 32.5 psu 0.7 µm <C<5 µm 32.5 32.5 psu 31.8 psu C (3 %) B (3 %) A (94 %) A (42 %) B (18 %) C (40 %) Two different size communities of phytoplankton Lee et al. (2007) • Depending on different water masses, there were two different communities • of phytoplankton in the Chukchi Sea in 2004
Compositions of small phytoplankton (<20 μm) Synechococcus 8.8% GD7 Prochlorococcus 21.4% Pico and Nano 69.8% HC49 WN3 HC24 WN1 SS4 HC60 SS5 Synechococcus 18.6% LS3 CEN4 LS1 CL3 Prochlorococcus CL1 CL6 Pico and Nano 14.5% CL7A CS12 CS16 66.9% CS4 CS8 CS1 In 2009, synechococcus and prochlorococcus species were found among small phytoplankton communities (<20um) in our study sites. These species were limited in the Arctic cold waters. But, recently water temperatures in the Chukchi Sea (next slide) have increased up to 5 C in this region. So, these species could survive !
Macromolecular compositions of phytoplankton (averaged from 3 water depths, 100, 30, and 1% at each station) Proteins Polysaccharides Lipids LMWM PHL12 ST14 A3 ST10 BSL3 High protein production Low nitrogen stress? Lee et al. (2009) • In general, phytoplankton produced more proteins than other macromolecular compositions such as lipids, • Polysaccharides, and LMWM, which indicates that phytoplankton might not have a nitrogen limitation in the Chukchi • Sea. This is an interesting result since phytoplankton especially in the Alaskan Costal Water were characterized • as having nitrogen limitation before.
C26 C22 Chukchi Sea C16 C29 Russia C14 C09 C04 Alaska RC03 B40 B42 B26 Bering Sea B21 B14 B10 B04 Station locations for 2007 Oshoro Maru cruise. Triangles show productivity stations
100 C16 80 C14 60 mg C m-2 h-1 C29 40 Chukchi Sea Russia 20 C26 C22 C09 C04 Alaska RC03 0 B26 B40 B42 Bering Sea B21 B14 B10 B04
100 80 60 40 Chukchi Sea Russia 20 RC03 Alaska C04 C16 0 B42 C09 C14 C22 C26 Bering Sea mg N m-2 h-1 C29 B40 B26 B21 B14 B10 B04
Bering Sea Chukchi Sea Carbon uptake rate (h-1) Light intensity (%)
Bering Sea Chukchi Sea Carbon uptake rate (h-1) Injected nitrate concentration (µM)
1 0.8 0.6 0.4 Chukchi Sea Russia 0.2 Alaska 0 Bering Sea f-ratios C04 RC03 B21 C22 C26 C16 C14 C29 C14 C09 00 B40 B42 B14 B26 00 B10 B04
Continuing measurement for Primary Productivity in the Chukchi Sea Lee et al. (2007) Lee et al. (2013) Lee et al. (2012) Lee et al. (in preparation) Recent productivity is ~3 times lower than decade(s) ago in the Chukchi Sea!
Primary Productivity Source Productivity Method Place or Water mass Season (g C m-2 day-1) McRoy et al. (1972) 4.1 14C uptake western Being Strait June Hameedi (1978) 0.1-1.014C uptake Chukchi Sea July > 3.0 central Chukchi Sea Sambrotto et al. (1984) 2.7 NO3- disappearance western Being Strait Springer (1988) 1.5-16 14C uptake central Chukchi Sea 11 July-2 August Korsak (1992)1.7 14C uptake Chukchi Sea 28 July-31 August Zeeman (1992) 1.614C uptake Chukchi Sea 28 July-31 August 0.8 Bering Strait Hansell et al. (1993) 4.8- 6.0 NO3- disappearance Anadyr Water in the north of Bering Strait Springer and McRoy 4.7 14C uptake and central Chukchi Sea 28 July-31 August (1993) chl-a concentration Hill and Cota (2005) 0.8 14C uptake northeastern Chukchi Sea summer Lee et al. (2007) 0.6 13C uptake Chukchi Sea 10-22 August 1.4 central Chukchi Sea Recent productivity was ~3 times lower than decade(s) ago in the Chukchi Sea!
Primary Productivity in the Chukchi Sea, 2012 (RUSALCA) 20 mg C m-2 h-1 Average ± S.D.= 27.9 ± 34.8 mg C m-2 h-1 HC26 G12 HC2 CEN1A CEN4 CL3R CL5A CS17 CL8 CS8 Alaska Russian Chukchi Sea 2012 productivity in the Chukchi Sea was still 3 times lower than decade(s) ago!
100 50 mg C m-2 h-1 0 Recent PP in the N Bering Sea, 2007 BRS-A5 KNG1 RUS4 NOM1 NOM5 KIV2 • 120 g C m-2 y-1 • (this study in 2007) ANSC SPH1 NWC2 SEC1 SIL2 NWC3 MK2 250-470 g C m-2 y-1 (Hansell and Goering 1990; Springer and McRoy 1993; Springer et al. 1996) SIL3 NWC4 SWC4 NWC5 NEC3 NEC5 Lee et al. (2012) Consistent 2-3 times lower productivity in the Northern Bering Sea!
Conclusions. Phytoplankton – smaller size classes appear to have increased Chlorophyll – integrated biomass decreased by 40% Primary Production – rates are reduced 2-3 fold since 1980’s Hypothesis: Large phytoplankton are growing fast enough to reduce the nutrient concentrations to low levels. Zooplankton are grazing on large phytoplankton leaving some of the small ones. Low chlorophyll values represent the remains from grazing and the low biomass produces the small primary production rates.