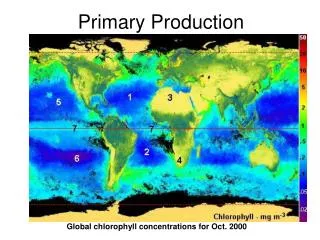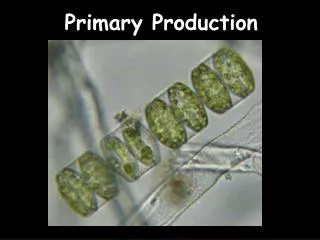
Primary Production
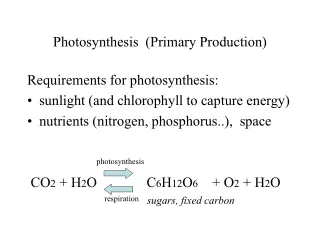
Primary Production. What Controls 1 º Production? Seasonal Succession in a Lake How to Measure 1 º Production. Controls of 1 º Productivity (Net Photosynthesis). Tolerance to physicochemical conditions. Light Turbulence Nutrients Grazing. Net P = Gross P – Respiration

Primary Production
E N D
Presentation Transcript
Primary Production What Controls 1º Production? Seasonal Succession in a Lake How to Measure 1º Production
Controls of 1º Productivity(Net Photosynthesis) • Tolerance to physicochemical conditions. • Light • Turbulence • Nutrients • Grazing • Net P = Gross P – Respiration • Photosynthesis vs Irradiance (PI curves) • Light saturation (Pmax) • Photoinhibition
Controls of 1º Productivity • Tolerance: temperature, pH and others (UV; Sidebar 11.1). 2a) Light: • Decreases with depth. • Decreases faster with turbid water. • Compensation depth: • Depth when cell photosynthesis = respiration. • More turbidity causes a shallower (lower) compensation depth. • At a depth where only 1% photosynthetic light remains = Euphotic Zone
photoinhibition 2b) Turbulence (mixing): • Low when stratified. • Population stays in the light and grows. • High when stormy. • Population mixed too deep will die/declines. • Critical depth. • Population alive above • Population death below
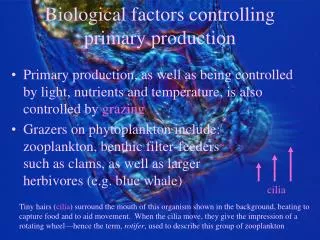
3) Nutrients (P, N, Si): • Deep winter mixing replenishes surface nutrients • Stratification minimizes supply from deep waters • Regeneration from other organisms 4) Grazing: • Refers to the process of primary production being eaten by herbivores (e.g. cow). • Crustaceans like copepods and cladocera (additional organisms in benthic habitats). • Grazing zooplankton populations typically increase after phytoplankton increase.
Seasonal Phytoplankton Succession * An annual cycle of species dominance in response to abiotic and biotic factors associated with seasonal changes in a temperate / cold-temperate lake. * Eight stage model: • Mid-winter • Late winter • Spring circulation • Initial summer stratification • Summer “clearwater” phase • Late summer stratification • Fall circulation • Late autumn decline
1. Midwinter • Low temperature • stable water column (inverse thermal stratification) • high light reflectance due to snow cover (low penetration) • moderate to high nutrient availability Phytoplankton community dominated by small, motile, low-light adapted phytoplankton Though not common, in some cases rates of primary production under ice cover can be constitute a significant portion of annual production when there is no snow.
2. Late winter • Low temperature • Stable water column • Moderate to high nutrient availability • Increasing light availability due to longer days, ice melt Rapid increase in motile species, particularly dinoflagellates In lakes that do not ice over (e.g. temperate monomictic lakes), phytoplankton biomass remains low due to deep mixing and decreased light levels.
4. Initial Summer Stratification • Rapidly increasing temperature • Water column stabilizes • Light availability increasing rapidly to maximum • Declining nutrient availability (why and what nutrients?) Phytoplankton biomass declines rapidly due to sedimentation of diatoms, compensated by rapid growth of small flagellates Grazing by zooplankton increases rapidly during this period, due to hatching and response to prey density.
5. Summer “Clearwater” Phase • High temperatures • High water column stability • High light availability • Sharply reduced nutrient availability (why?) Precipitous decline in phytoplankton populations due to nutrient limitations and high zooplankton grazing (clearance rate exceeds reproductive rates). • Zooplankton biomass high due to timing of hatching, high production in response to spring bloom; silica limitation common due to sedimentation of diatoms
6. Late Summer Stratification • High temperature • Stable but decreasing water column stability and deepening of metalimnion • High but decreasing light availability • Low but increasing nutrient availability Increasingly diverse phytoplankton community, especially cyanobacteria and green algae (diatoms still silica-limited)
7. Fall Circulation • Rapidly declining temperatures • Rapid vertical mixing, no water column stability • Decreasing light availability • High nutrient availability (why and what nutrients in particular?) Phytoplankton dominated by large algae, particularly diatoms Zooplankton populations in decline, grazing pressure is reduced.
8. Late Autumn Decline • Low temperature • Decreased mixing of water column • Light availability rapidly declining to annual minimum • Rapidly decreasing nutrient availability (why?) Rapid decline in phytoplankton biomass due to reduction in light and nutrient levels. Grazing rates decreasing to annual minimum
Seasonal community structure beyond phytoplankton… Fig. 20.5
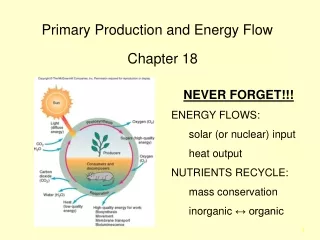
Net Primary Production(= Net Photosynthesis) • Net Primary Production (NPP) is Gross Primary Production (GPP) minus Respiration (R). • These are rate measurements and can be reported in units of mg DO/L/d, or these values can be converted to organic carbon equivalents, mg C/L/d. This conversion requires the atomic mass conversion and a photosynthetic quotient (PQ = +ΔO2 / - ΔCO2). • NPP may be measured as: • changes in oxygen content (light/dark incubations; whole lake) • uptake of CO2 into biomass (using radioactive 14CO2).
Measuring Dissolved Oxygen • DO by Winkler Titration: • The relevant chemical reactions occurring throughout the procedure are outlined below: Mn2+ + 2OH- + 1/2 O2→ oxygen-manganese complex + H2O (1) oxygen-manganese complex + 4H+ + 2I- → I2 + Mn2+ + 2H2O (2) I2 + 2Na2S2O3→ Na2S4O6 + 2NaI (3) • Reaction Steps: #3) Add Na-thiosulfate until yellow; add starch indicator to enhance endpoint; continue titrating until clear (endpoint) Water sample #1 #2 → → →
Measuring Dissolved Oxygen 2) DO by electro-chemical probe: Voltage applied across cathode reacts with O2 and causes an electrical flow from the anode. At cathode: O2 + 4H+ + 4e-→ 2H2O OxyGuard Probe Orion DO Probe
Phytoplankton 1º Production by Light / Dark Incubations. • Volumetric estimate of primary production is performed at depth intervals across the euphotic zone. • These values are integrated over depth of the lake to derive an areal primary production. • These data must be corrected for lake morphology.
The lake is not the same surface area at each depth; so areal 1ºProduction estimates must account for these differences. • A lake morphology correction yields an areal 1ºProduction value representing the average for any area of the lake. • Such that, this morphology corrected average value can be multiplied by lake surface area to yield total lake phytoplankton production. • What about littoral zone benthic algea (periphyton) and macrophytes? Lake shape corrected deepest site; uncorrected
NPP= GPP -R GPP Relative DO concentration R Whole Community Rates by Daily Oxygen Budgets