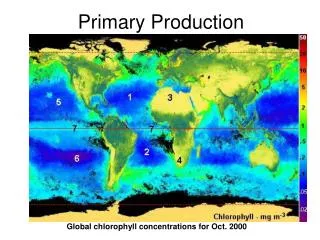
Primary Production
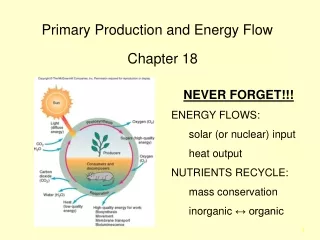
Primary Production. Production: Formation of Organic Matter. Autotrophic Organisms (Plants, algae and some bacteria) Photosynthesis Chemosynthesis CO 2 + Electron Donor + energy CH 2 O + other Heterotrophic Organisms (most bacteria and animals)

Primary Production
E N D
Presentation Transcript
Production: Formation of Organic Matter • Autotrophic Organisms (Plants, algae and some bacteria) • Photosynthesis • Chemosynthesis CO2 + Electron Donor + energy CH2O + other • Heterotrophic Organisms (most bacteria and animals) RESPIRATION(Autotrophs & Heterotrophs) CH2O + O2 CO2 + H2O + Energy (ATP)
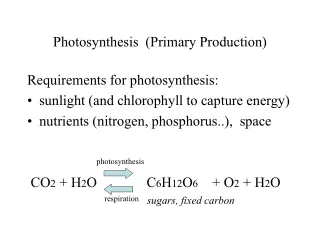
Photosynthesis 6CO2 + 6H2O +light C6H12O6 + O2 Need: Co2, H2O, Light and….. N DNA, RNA, Proteins P Energy Transport, DNA, RNA Fe Photosynthetic electron chain ….
Nutrients • Macronutrients: N, P, Si, S, Mg, K… • Micronutrients: Cu, Fe, Se… Redfield Ratios: P N C SW 1 15 1000 Phytopl. 1 16 106
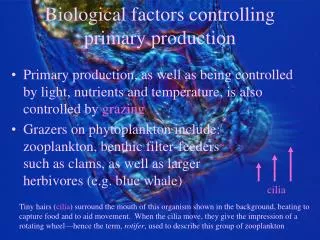
Oceanic Productivity Limiting Factors • Light • Nutrients
Bristlecone Pine: 4.723 years old!
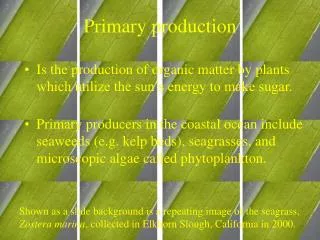
Kelp Forest Macroalgae: 3% Ocean Photosynthesis www.underwaterplanet.com
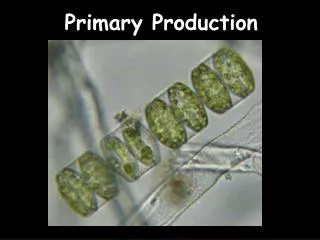
Phytoplankton Phytoplankton: 97% Ocean Photosynthesis
Phytoplankton Dominance • Phytoplankton • Optimize surface area/volume (4/3Пr2) / (4/3Пr3) • Smaller size larger surf. area/volume • 5μm = 1/5 • 10μm = 1/10 • Small Particles sink slower • Larger surf. area/volume Slower sinking
Phytoplankton spines: increase in surface for higher floatability
Measuring Productivity • Plant Biomass • How much phytoplankton is there (mg Chl/m3) or (μg Chl/liter) • Productivity • A rate of how much carbon is produced per time • g Carbon / m3 / day • GROSS Productivity = Carbon fixed through Photosynthesis per time • NET Productivity = Gross Prod - Respiration
What do Chl maps really measure? Biomass!
So Chl concentration is reasonable estimation of primary productivity in surface waters
Vertical distribution of Primary production • Surface photoinhibition (UV light?) • Photosynthetic Maximum • Compensation depth • Critical Depth • Refers to the whole population • Photosynthesistotal= Respirationtotal
Critical Depth • CRITICAL DEPTH: Depth at which total primary productivity = Total respiration • MIXING DEPTH – Depth above which all water is throughly mixed (WIND) THE PUNCHLINE: • MIXING DEPTH > CRITICAL DEPTH: Then Phytopl. are partially swept down and a bloom cannot not occur • MIXING DEPTH < CRITICAL DEPTH: then a Phytopl. Bloom can occur