PRIMARY PRODUCTION AND ENERGY FLOW
550 likes | 774 Vues
PRIMARY PRODUCTION AND ENERGY FLOW. Chapter 18. Chapter Concepts. Terrestrial Primary Production limited by temperature and moisture Aquatic Primary Production limited by nutrient availability Consumers can influence rates of primary production in terrestrial and aquatic ecosystems

PRIMARY PRODUCTION AND ENERGY FLOW
E N D
Presentation Transcript
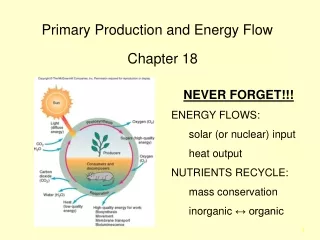
PRIMARY PRODUCTION AND ENERGY FLOW Chapter 18 Molles: Ecology 2nd Ed.
Chapter Concepts • Terrestrial Primary Production limited by temperature and moisture • Aquatic Primary Production limited by nutrient availability • Consumers can influence rates of primary production in terrestrial and aquatic ecosystems • Energy losses limit the number of trophic levels found in ecosystems Molles: Ecology 2nd Ed.
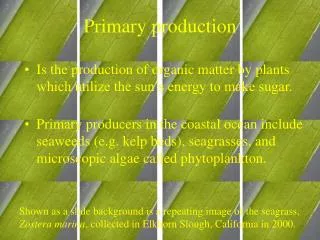
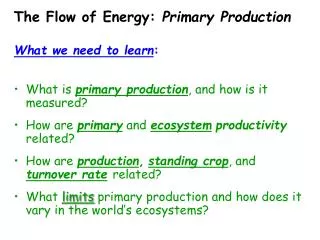
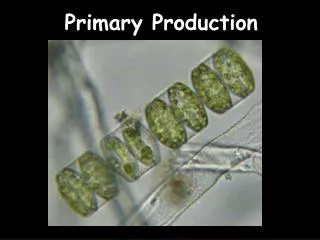
Fundamental Concepts • Primary Production • Fixation of energy by autotrophs in an ecosystem • Or, conversion of inorganic energy (light) into organic forms (chemical potential energy) Molles: Ecology 2nd Ed.
Rate of Primary Production • Amount of energy fixed during period of time • Gross PP – Total amount of energy fixed • Net PP – Amount of energy leftover after autotrophs have met their metabolic needs (subtract plant respiration) • This is amount left over for consumption by herbivores Molles: Ecology 2nd Ed.
Fundamental Concepts • Trophic Level • Position in food web determined by number of energy transfers from primary producers to current level: • Primary producers = first level • Primary consumers = second level • Secondary consumers = third level • Tertiary consumers = fourth level Molles: Ecology 2nd Ed.
Evapotranspiration and Terrestrial Primary Production • Rosenzweig (1968) • Estimated influence of moisture and temperature on rates of primary production • Plot annual net primary production and annual actual evapotranspiration (AET) Molles: Ecology 2nd Ed.
Plot annual net primary production and annual actual evapotranspiration (AET) • AET – annual amount of water that evaporates and transpires • Cold dry ecosystems tend to have low AET Fig 18.2 Molles: Ecology 2nd Ed.
Evapotranspiration and Terrestrial Primary Production • Positive relationship between net primary production and AET • Sala found east-west variation in primary production correlated with rainfall Molles: Ecology 2nd Ed.
So? • Rainfall or, rainfall and temperature • Predict net primary productivity in terrestrial ecosystems Molles: Ecology 2nd Ed.
Soil Fertility and Terrestrial Primary Production • Soil fertility is important too! • Shaver and Chapin • Arctic net primary production twice as high on fertilized plots compared to unfertilized plots Molles: Ecology 2nd Ed.
Bowman • N is main nutrient limiting net primary production in a dry tundra meadow; • N and P jointly limit production in a wet meadow Molles: Ecology 2nd Ed.
Fig 18.5 Molles: Ecology 2nd Ed.
Patterns of Aquatic Primary Production • Several studies found quantitative relationship between phosphorus and phytoplankton biomass • – nutrient availability controls rate of primary production in freshwater ecosystems Molles: Ecology 2nd Ed.
Figure 18.9 Molles: Ecology 2nd Ed.
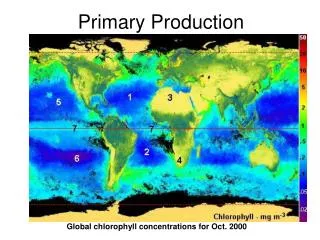
Global Patterns of Marine Primary Production • Highest primary production by marine phytoplankton – • in areas with higher levels of nutrient availability • = continental margins • Nutrient run-off from land • Sediment disturbance • Open ocean tends to be nutrient poor • Vertical mixing main nutrient source Molles: Ecology 2nd Ed.
Alfalfa Field Young Pine Plantation Middle-Aged Oak Forest Mature Tropical Rain Forest Total Solar Radiation 2,091,000 2,091,000 2,091,000 2,415,000 Gross Primary Production 24,400 12,200 11,400 45,000 Respiration 9,200 4,700 6,400 32,000 Net Primary Production 15,200 7,500 5,000 13,000 GPP / Total Solar Radiation 0.0117 (1.17%) 0.0058 (0.58%) 0.0055 (0.58%) 0.0186 (1.86%) NPP / GPP 0.62 (62%) 0.61 (61%) 0.44 (44%) 0.29 (29%) A Comparative Analysis of Annual Primary Production (Kcal / m2 /yr)
Summary of Comparisons of Ecosystem Primary Production • Efficiency of primary production is reduced by drought or freezing-induced dormant seasons (sun light going to waste) • Efficiency of primary production is reduced by high temperatures that increase respiration w/o increasing photosynthesis. • Efficiency of primary production is reduced by large amounts of non-photosynthetic plant biomass (increase respiration w/o increasing photosynthesis).
Ecosystem Net Primary Production Plant Biomass Tropical Rain Forest 2000 44 Swamps & Marshes 2500 15 Algal Beds & Coral Reefs 2000 2 Boreal Conifer Forest 800 20 Savanna (Grass + Trees) 700 4 Ocean Upwelling Zone 500 0.02 Association b/t Plant Biomass and Primary Production (There isn’t one) } }
Consumer Influences • Bottom-Up Controls • Influences of physical and chemical factors of an ecosystem • Top-Down Controls • Influences of consumers Molles: Ecology 2nd Ed.
Lake Primary Production • Carpenter et al. (1985) • Piscivores + planktivorous fish can cause significant deviations in primary productivity • Carpenter and Kitchell (1988) • Influence of consumers on lake primary productivity propagate through food webs • = Trophic Cascade Hypothesis Molles: Ecology 2nd Ed.
Fig 18.11 Molles: Ecology 2nd Ed.
Fig. 18.13 Molles: Ecology 2nd Ed.
Carpenter + Kitchell • Whole lake experiments • N. Wisconsin / UP Michigan Molles: Ecology 2nd Ed.
UNDERC • Three lakes: Peter, Paul, Tuesday • 1985: reciprocal transplants of fish Molles: Ecology 2nd Ed.
Carpenter and Kitchell experiment • Three experimental lakes • Two w/bass • One winterkill lake; Tuesday – no bass • Many planktivore fishes = minnows Molles: Ecology 2nd Ed.
Experiment: • Remove 90% bass from Peter lake • Put into Paul lake • Remove 90% planktivores from Paul lake • Put into Peter lake • Third lake = control (Tuesday) Molles: Ecology 2nd Ed.
Lake Primary Production • Carpenter and Kitchell • Fewer planktivorous fish led to reduced rates of primary production • No planktivorous minnows resulted in more predator invertebrates • Abundant, large herbivorous zooplankton increased, phytoplankton biomass and primary productivity Molles: Ecology 2nd Ed.
Fig 18.13 Summary Molles: Ecology 2nd Ed.
Primary Production in the Serengeti • 25,000 km2 grassland • Millions of large mammals still present Molles: Ecology 2nd Ed.
McNaughton (1985) • Serengeti grazers consume average of 66% of annual primary production • Rate of primary production in Serengeti positively correlated with rainfall quantity Molles: Ecology 2nd Ed.
Primary Production in the Serengeti • Found that grazers can increase primary production • Increased growth rate = • Compensatory Growth is plant response • Lower respiration rate due to lower biomass • Reduced self-shading • Improved water balance due to reduced leaf area Molles: Ecology 2nd Ed.
Fig 18.14 Molles: Ecology 2nd Ed.
Primary Production in the Serengeti • In addition, McNaughton found compensatory growth highest at intermediate grazing intensities • Light grazing insufficient to produce compensatory growth • Heavy grazing reduces plant’s capacity to recover Molles: Ecology 2nd Ed.
Fig. 18.15 Molles: Ecology 2nd Ed.
Trophic Dynamic View of Ecosystems • Lindeman (1942) • Ecosystem concept fundamental to study of energy transfer within an ecosystem • Suggested grouping organisms within an ecosystem into trophic levels • Each feeds on level immediately below • As energy is transferred from one trophic level to another, energy is degraded Molles: Ecology 2nd Ed.
Trophic Dynamic View of Ecosystems • As energy is transferred from one trophic level to another, energy is degraded: • Limited assimilation • Consumer respiration • Heat production • Energy quality decreases with each successive trophic level • Pyramid-shaped energy distribution Molles: Ecology 2nd Ed.
Fig. 18.16 Molles: Ecology 2nd Ed.
Trophic Pyramids Because there is not enough energy to support large populations at the highest trophic levels. Why are big, fierce animals (top carnivores) rare ? Bio-magnification
Human Trophic Pyramid 10 6 10 7 10 10
After 30 Years of Increase, Grain Production per Person Has Stabilized Agricultural production just keeping pace with human population growth Green Revolution Agricultural production increases faster than human population
What was the “Green Revolution” • Genetic improvement of crop species to increase grain yields and resistance to pests, disease, wind damage. • Increased use of fertilization, herbicide, pesticide, and irrigation. All the “easy” gains in production have been obtained. Further gains will come slowly, if at all. Negative effects of fertilization, pesticides and irrigation are beginning to affect production The human population continues to grow
Acreage of Productive Farmland Is Declining In the USA • From 1992 – 1997 six million acres of farm land were converted to developed use. • We lost farm and ranch land 51% faster in the 1990’s than in the 1980’s. • Prime agricultural land is being converted 30% faster than non-prime rural lands. • We must depend more on food production from marginal land that requires more irrigation and fertilization. “Farming On the Edge” (American Farmland Trust)
Losing Farm Land (USA) 25% of U.S. food supply comes from the California Central Valley
Losing Farm Land (Indiana) • Wasteful land use is the problem, not growth itself.
Losing Farm Land (Indiana) • Wasteful land use is the problem, not growth itself. • From 1982-1997 the U.S. population grew by 17%, while urbanized land grew by 47%.
Losing Farm Land (Indiana) • Wasteful land use is the problem, not growth itself. • From 1982-1997 the U.S. population grew by 17%, while urbanized land grew by 47%. • Over the past 20 years, the acreage per person for new housing almost doubled .
Losing Farm Land (Indiana) • Wasteful land use is the problem, not growth itself. • From 1982-1997 the U.S. population grew by 17%, while urbanized land grew by 47%. • Over the past 20 years, the acreage per person for new housing almost doubled . • Since 1994, 10+ acre housing lots have accounted for 55% of land developed.
Energy Flow In the Human Food Chain Energy In Corn Grain (8.2 million Kcal) Maybe humans should just eat the corn Not assimilated by cow Energy Assimilated by Feedlot Cattle (7.0 million Kcal) Respiration Energy in the Body of Mature Feedlot Cattle (1.2 million Kcal) Waste in meat processing Energy in Meat from Feedlot Cattle (0.4 million Kcal) 5% of Energy in Corn is Available In Beef