Download
1 / 25
260 likes | 472 Vues
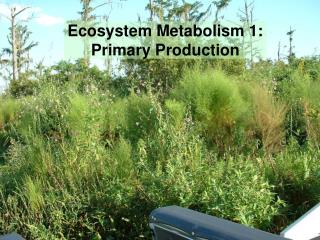
Primary production & DOM. OUTLINE: What makes the PP levels too low? 1- run 760 - Boundary conditions not seen (nudging time) Phytoplankton parameter: (Grazing: G max , K phy ) Background diffusivity: K z_bak Results and comparisons (Chla, semilabile DOC) 2- run 761

E N D
Primary production & DOM OUTLINE: What makes the PP levels too low? 1- run 760 - Boundary conditions not seen (nudging time) Phytoplankton parameter: (Grazing: Gmax, Kphy) Background diffusivity: Kz_bak Results and comparisons (Chla, semilabile DOC) 2- run 761 Phytoplankton parameters: max KCDOM Results and comparisons (Chla)
St. Augustine Cross-Shelf Transects of Chlorophyll, Nitrate, and PAR GABEX-II In Situ NENA 758 (1/=0) NENA 760 (1/=20 d)
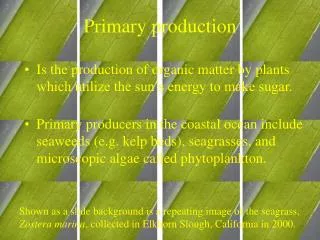
Primary production Original at 6 & 25oC Modified at 6 & 25oC = initial slope of the PI curve f(I)= I / sqrt(max2+(I)2) I (W.m-2) max (d-1) Thus is in (W.m-2 )-1. d-1 Not in mg C.(mg Chl)-1.(W.m-2 )-1. d-1 as in the code. Original value = 0.025 (W.m-2 )-1. d-1 Literature = 0.017-0.025-0.050-0.140 (W.m-2 )-1. d-1 Value chosen = 0.050 (W.m-2 )-1. d-1
Grazing The balance between producers and grazers has been slightly modified introducing a variable (and mostly lower) assimilation efficiency for modeling the sloppy feeding: Maximum grazing: Gmax Original value = 0.6 d-1 Literature = 0.5-0.9-1.0-1.2 d-1 New value Gmax = 0.75 d-1 Half-saturation constant: Kphy Original value = 2.0 (mmol N.m-3)2 Literature = 0.56-3.5 (mmol N.m-3)2 New value Kphy = 1.5 (mmol N.m-3)2
10-6 m-2.s-1 Primary production Station 1 10-5 m-2.s-1 Net vertical diffusion of DIN 10-6 m-2.s-1 Background diffusivity: Kz_bak Original value = 10-6 m-2.s-1 Literature = 5. 10-6 m-2.s-1 (Mackinnon et al. 2005) Since small scale processes are not taken into account in the 10 km grid, as well as internal waves, the value chosen is: Kz_bak = 10-6 m-2.s-1 Station 3 10-5 m-2.s-1
Primary production Run 758 What makes the PP levels too low… • - Boundary conditions • - *2 • Kz_bak Run 760 … in the North?
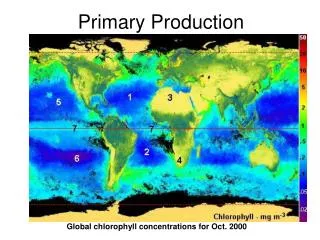
-Too low in winter North of Cape Hatteras • Especially GoM • Bloom occurs in April North of Cape Hatteras ROMS SeaWiFS Chlorophyll JAN FEB MAR APR
Modeled bloom occurs in May/June, thus with a 4-6 weeks delay • Summer levels are reasonable ROMS SeaWiFS Chlorophyll MAY JUN JUL AUG
Lack of horizontal gradient from the coast towards off-shore. • Too low values again North of Cape Hatteras. ROMS SeaWiFS Chlorophyll SEP OCT NOV DEC
ROMS SeaWiFS TOTAL DOC MAY JUN JUL AUG • FOCUS ON THE MAB !
Primary production SEASONAL TEMPERATURE (max) What makes the PP levels too low… SEASONAL SALINITY (KCDOM) Run 760 …especially in the North?
Primary production KCDOM = f(salinity) The CDOM traced here is terrestrial since the marine fraction is implicitly included in the KChl Formulation based on MARMAP data located in the MAB with the hypothesis that the Chl level is reasonable Leads to a permanent anomaly in the northern part due to fresher waters from the Labrador current with a priori no terrestrial CDOM and due to the lack of attenuation from the too low Chl levels Test performed with a KCDOM set to a low salinity formulation: KCDOM =-0.02*Salt+0.6
Original at 6 & 25oC Modified at 6 & 25oC Primary production Winter Gulf of Maine Is the maximum growth temperature-dependant? -Temperature is not needed to reproduce the phytoplankton seasonal cycle, species are adapted to their environment. -Brush et al. 2002 showed that the use of the Eppley (1972) formulation leads to an underestimation of the PP. -They even recommend the use of an empirical formulation independent of temperature, following an observed consistent relationship between PP and the photic depth, the chlorophyll content in the photic zone and the surface irradiance. - Test performed with a constant maximum growth rate = 2.5 d-1 = initial slope of the PI curve Former value = 0.050 (W.m-2 )-1. d-1 Value chosen = 0.025 (W.m-2 )-1. d-1 Result shown • Current test • = 0.020 (W.m-2 )-1. d-1 max = 2.2 d-1
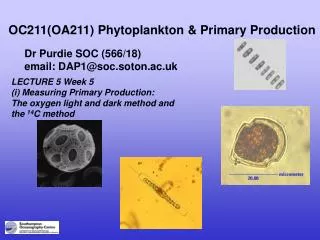
RUN 761 • = 0.020 (W.m-2 )-1. d-1 max = 2.2 d-1 • KCDOM=-0.02*Salt+0.6 ROMS SeaWiFS Chlorophyll JAN FEB MAR APR
RUN 760 • = 0.025 (W.m-2 )-1. d-1 max = Eppley (1972) • KCDOM= MARMAP ROMS SeaWiFS Chlorophyll JAN FEB MAR APR
January-April Primary Production Run 760 Run 761
Conclusion • Primary production and chlorophyll levels are about to be calibrated, some refinement might be necessary. • The specificities of phytoplankton dynamics are well simulated in the SAB and MAB. • Realistic DOC levels and distribution are shown in summer. • The primary production must be realistic for the rest of the year to be able to simulate reasonably the DOC.