Understanding Electromagnetic Spectrum and Imaging Techniques
Explore the world of electromagnetic waves, from visible light to infrared and microwave bands. Learn about measuring light, thermal infrared, and atmospheric effects, as well as remote sensing techniques, image corrections, and thematic data analysis in the context of multispectral imaging.

Understanding Electromagnetic Spectrum and Imaging Techniques
E N D
Presentation Transcript
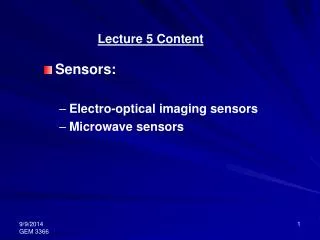
Lecture 4 Content Electromagnetic wave
Electromagnetic wave • Visible light, radio waves, heat, ultraviolet, and X-rays are all forms of electromagnetic energy • All forms of electromagnetic energy travels at the speed of light which is 3 x 10⁸ m/sec • The type of energy being detected is characterized by its position in the electromagnetic spectrum • The spectrum is commonly divided into units of wavelengths measured in micrometers (μm) which is one millionth of a meter
Wavelength Visible ˜ 0.7 ˜ 0.4 micrometers Measuring Light • Light can be classified according to the length of the wave The Electromagnetic Spectrum (EMS) Microwave Gamma Rays X-Ray Ultraviolet Infrared TV/Radio
Measuring Light: Bands • Human eyes only ‘measure’ visible light • Sensors can measure other portions of EMS Bands
Electromagnetic spectrum characteristics • Visible portion: • Region to which the human eye is sensitive • Extremely narrow range of wavelengths • Wavelength: 0.4 μm to 0.7 μm ( the blue and red regions) • The ultra-violet region has the shorter wavelengths next to the visible blue region
Infra-red portion • Cannot be seen directly with the human eye • Wavelength: 0.7 μm to 0.8 μm • Longer than the red rays in the visible portion • Useful for penetrating hazy weather conditions
Thermal infra-red portion • Cannot be detected by the human eye nor by photographic film • Wavelength: 0.8 μm to 14 μm • Electronic detectors cooled by liquid nitrogen are used to measure the energy emitted at these wavelengths
Microwave portion • Very low intensity • Wavelength: 1mm to 1m • Useful for penetrating hazy weather conditions
Emission of energy from a blackbody • Area under the curve represents the total amount of energy emitted • Sun’s highest energy levels are emitted at the wavelength 0.5 μm • Atmospheric effects • Atmospheric windows are the regions of the spectrum that are used for remote sensing • The systems operating in wavelengths longer that the visible range makes use of such windows for which the atmosphere has relatively high transparency
Swath • Sensors collect 2D images of the surface in a swath below the sensor • Example: Landsat has a 185 km swath
Two types of images • REMOTELY SENSED images Continuous data • Measured Values (light) • Quantitative • THEMATIC Images Discrete data • Values only indicate class • Qualitative
Multispectral ( 2 or more Bands) • Panchromatic ( 1 Band/layer) Continuous data • Two types:
Thematic Mapper Band 1 Band 4 Band 5 Viewing continuous images • Each band or layer is viewable as a separate image
Monitor color guns Part of spectrum Band 4 Band 1 Band 4 Blue Green Band 3 Band 5 Band 2 Red NIR Band 2 Band 3 Band 3 SWIR Viewing images • Three bands are viewable simultaneously
Urban Vegetation Band Combinations • Features can become more obvious 4,5,3 (RGB) 2,3,1 (RGB) 4,3,2 (RGB)
Image Geometric Correction • Raw imagery has no reference to the ground Location in image only Defined by raster grid only
Image Geometric Correction • Correction is the process of giving an image a Real World coordinate system 116 41 52.20 W, 33 50 03.23 N (Latitude, Longitude)
116 28 55.20 W, 33 00 22.43 N 116 47 27.20 W, 33 50 50.09 N Resampling Method 116 28 07.20 W, 33 55 43.98 N 116 45 14.54 W, 33 43 05.65 N Ground Control • Raw images need ground control • Measured control points are used to correct entire image
Discrete data (Thematic images) • Deal with categorical information about an area • Used and created by analytical operations • Used to extract information from multispectral images
Viewing thematic images • Thematic images • Each pixel contains a class value • Each class value is associated with a specific color
Viewing thematic images • Each class can have associated attributes: • Name, Color, Area etc. Exe…
Vector Raster Polygons Lines Points Vector Coverages • Different means of representing features
Vectors colored according to attributes Vector Coverages • Vectors can also have attributes