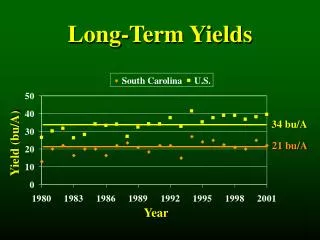
Long Term Stability Test
Long Term Stability Test. University of Tsukuba Yusuke TAKAHASHI. 2009/07/29 for ILC meeting. Cut. (P7-P4)-(P4 -P1) <0 :peak position correction (P4-P1)-(P5+P2) >0 (P7-P4)-(P8+P5) >0 : Pk–Pk is away enough. d = p1-p0 S = ADC Resolution (= 0.25pC/ADCcount)

Long Term Stability Test
E N D
Presentation Transcript
Long Term Stability Test University of Tsukuba Yusuke TAKAHASHI 2009/07/29 for ILC meeting
Cut • (P7-P4)-(P4 -P1) <0 :peak position correction • (P4-P1)-(P5+P2) >0 (P7-P4)-(P8+P5) >0 : Pk–Pk is away enough d = p1-p0 S = ADCResolution (= 0.25pC/ADCcount) e = electric charge(= 1.6 x10⁻¹⁹ C) A = HAMAMATSU AMP Gain(= 63)
Correction of 3-Gaussian fit Before After
Gain Vs Vbias(Before) Type B Type A ・25 ・30 ・40 ・50 ・60 ・25 ・30 ・40 ・50 ・60 Sample #1102 ・25 ・30 ・40 ・50 ・60 ・25 ・30 ・40 ・50 ・60 Sample #1103
Gain Vs Vbias(After) Type B Type A ・25 ・30 ・40 ・50 ・60 ・25 ・30 ・40 ・50 ・60 Sample #1102 ・25 ・30 ・40 ・50 ・60 ・25 ・30 ・40 ・50 ・60 Sample #1103 • 温度を横軸に、V0,Capacitance をそれぞれ縦軸にとり温度依存性を見る
V0Temperature dependence(Before) #1102 Type A α:0.051 ± 0.001V/℃ β:72.84 ± 0.02 V #1102 Type B α:0.051 ± 0.001V/℃ β:72.83 ± 0.02 V #1103 Type A α:0.053 ± 0.001V/℃ β:72.82 ± 0.02 V #1103 Type B α:0.051 ± 0.001V/℃ β:72.88 ± 0.02 V α:Temperature coefficient[V/℃] β:V0 [V] @ 0 ℃ ・#1102 TypeA ・#1102 TypeB ・#1103 Type A ・#1103 Type B
V0Temperature dependence(After) #1102 Type A α:0.050 ± 0.001V/℃ β:72.82 ± 0.02 V #1102 Type B α:0.051 ± 0.001V/℃ β:72.79 ± 0.03 V #1103 Type A α:0.053 ± 0.001V/℃ β:72.80 ± 0.02 V #1103 Type B α:0.051 ± 0.001V/℃ β:72.86 ± 0.02 V α:Temperature coefficient[V/℃] β:V0 [V] @ 0 ℃ ・#1102 TypeA ・#1102 TypeB ・#1103 Type A ・#1103 Type B
Capacitance Temperature dependence(Before) #1102 Type A Capacitance 1.584 ± 0.004 ×10⁻²pF #1102 Type B Capacitance 1.611 ± 0.004 ×10⁻²pF #1103 Type A Capacitance 1.564 ± 0.004 ×10⁻²pF #1103 Type B Capacitance 1.610 ± 0.004 ×10⁻²pF Capacitance is assumed to be no temperature dependence. ・#1102 TypeA ・#1102 TypeB ・#1103 Type A ・#1103 Type B
Capacitance Temperature dependence(After) #1102 Type A Capacitance 1.575 ± 0.004 ×10⁻²pF #1102 Type B Capacitance 1.603 ± 0.004 ×10⁻²pF #1103 Type A Capacitance 1.555 ± 0.004 ×10⁻²pF #1103 Type B Capacitance 1.600 ± 0.004 ×10⁻²pF Capacitance is assumed to be no temperature dependence. ・#1102 TypeA ・#1102 TypeB ・#1103 Type A ・#1103 Type B Capacitancedose not depend at the temperature.
Set Up(NoiseRate) Noise CAMAC Discriminator Coincidence Clock Generator 20ns 10MHz Scaler Gate Generator Width 0.5s 25ns PC 1Hz ECL to NIM 25ns Discriminator Thermostatic chamber(25℃) AMP×63×10 MPPC Vth hoge Digital Multi Meter GPIB Voltage source RS232C
Threshold Curve Over Voltage 3[V] Width 25 ns Threshold Curve Sample #1102 Type A Vth [mV] Threshold Curve (derivation) Vth [mV]
Noise Rate(0.5 p.e.) Type B Type A ・25 ・30 ・40 ・50 ・60 Sample #1102 Sample #1103 Noise Rate grows, too , as the temperature rises.
#1103Type A ・25 ・30 ・40 ・50 ・60 The cause of the miss data is unknown. Remeasurement was finished. But, the analysis has not finished yet.
Noise Rate(1.5 p.e.) Type B Type A ・25 ・30 ・40 ・50 ・60 Sample #1102 Sample #1103
Cross-Talk Probability Type A Type B ・25 ・30 ・40 ・50 ・60 Sample #1102 Sample #1103 Cross-Talk Probability doesn’t depend at the temperature.
Leakage Current Type A Type B ・25 ・30 ・40 ・50 ・60 Sample #1102 Sample #1103 Leakage Current grows, too , as the temperature rises.
Progress The measurement of long-term stability began on July 7. Temperature monitor T = 85 ℃ ⊿V = 3 V Sample #1102 Sample #1103
Summary & Plan Summary • V0 changes into the temperature linear. • Capacitance and Cross-Talk Probability doesn’t depend at the temperature. • Leakage Current depends at the temperature. Plan • It is necessary to do the remeasurement data analysis. • It is necessary to do Cross Talk correction. • (accidental 2p.e. signal is excluded) • Leak Current is analyzed, and understood.
T=40℃ Vbias 79.07 Type B Type A Sample #1102 Sample #1103
Gain V0 Type A :74.10 ±0.01 V Type B :74.12 ±0.01 V V0 Type A :74.14 ±0.01 V Type B :74.17 ±0.01 V ・TypeA ・Type B Sample #1102 Capacitance Type A :1.601±0.006×10⁻²pF Type B :1.644±0.008×10⁻²pF Capacitance Type A :1.586±0.006×10⁻²pF Type B :1.611±0.006×10⁻²pF Sample #1103 ・TypeA ・Type B V0が一致し、Capacitanceも一致した。 ⇒新しい回路でGainに対する差異はない。
Gain Vs Vbias Type B Type A ・25 ・30 ・40 ・50 ・60 ・25 ・30 ・40 ・50 ・60 Sample #1102 ・25 ・30 ・40 ・50 ・60 ・25 ・30 ・40 ・50 ・60 Sample #1103 • 温度を横軸に、V0,Capacitance をそれぞれ縦軸にとり温度依存性を見る
V0 温度依存性 #1102 Type A α:0.051 ± 0.001V/℃ β:72.84 ± 0.02 V #1102 Type B α:0.051 ± 0.001V/℃ β:72.83 ± 0.02 V #1103 Type A α:0.053 ± 0.001V/℃ β:72.82 ± 0.02 V #1103 Type B α:0.051 ± 0.001V/℃ β:72.88 ± 0.02 V α:温度係数 [V/℃] β:0℃のときのV0 [V] ・#1102 TypeA ・#1102 TypeB ・#1103 Type A ・#1103 Type B
Capacitance 温度依存性 #1102 Type A Capacitance 1.589 ± 0.004 ×10⁻²pF #1102 Type B Capacitance 1.616 ± 0.004 ×10⁻²pF #1103 Type A Capacitance 1.567 ± 0.004 ×10⁻²pF #1103 Type B Capacitance 1.607 ± 0.004 ×10⁻²pF Capacitance には 温度依存性がないと仮定 ・#1102 TypeA ・#1102 TypeB ・#1103 Type A ・#1103 Type B
Gain Vs Vbias(2) Sample#1102 Type A ・25 ・30 ・40 ・50 ・60 σ が2倍になる Vbias 79.0[V] を上限として同じ解析をした ↓:Pedestal をGaussian Fit したときの σ をBias Voltageで比較した ・25 ・30 ・40 ・50 ・60
V0 温度依存性(2) #1102 Type A α:0.049 ± 0.001V/℃ β:72.86 ± 0.03 V #1102 Type B α:0.050 ± 0.001V/℃ β:72.83 ± 0.03 V #1103 Type A α:0.050 ± 0.001V/℃ β:72.88 ± 0.03 V #1103 Type B α:0.051 ± 0.001V/℃ β:72.90 ± 0.03 V α:温度係数 [V/℃] β:0℃のときのV0 [V] ・#1102 TypeA ・#1102 TypeB ・#1103 Type A ・#1103 Type B 高温領域でも温度に対して線形に依存する。
Capacitance 温度依存性(2) #1102 Type A Capacitance 1.584 ± 0.004 ×10⁻²pF #1102 Type B Capacitance 1.611 ± 0.004 ×10⁻²pF #1103 Type A Capacitance 1.564 ± 0.004 ×10⁻²pF #1103 Type B Capacitance 1.610 ± 0.004 ×10⁻²pF Capacitance には 温度依存性がないと仮定 ・#1102 TypeA ・#1102 TypeB ・#1103 Type A ・#1103 Type B 温度が上がるにつれて Capacitanceが小さくなっている。
Summary & Plan Summary • 60℃までの Gain , Noise Rate ,Cross Talk , Leak Current の測定を終えた。 • V0 , Capacitance ,Cross Talk , Leak Current に温度依存性があるように見える。 Plan • 引き続き予備実験を続ける。(25~60℃の再測定) • Noise Rate ,Leak Currentの解析・理解を進める。
Rejected ADC distributions Type B Type A ・25 ・30 ・40 ・50 ・60 ・25 ・30 ・40 ・50 ・60 Sample #1102 ・25 ・30 ・40 ・50 ・60 ・25 ・30 ・40 ・50 ・60 Sample #1103 • T=40,50,60 について棄却したデータのADC分布を見る。
T=40℃ Vbias 79.07 Type B Type A Sample #1102 Sample #1103